
Reason to trust
How Our News is Made
Strict editorial policy that focuses on accuracy, relevance, and impartiality
Ad discliamer
Morbi pretium leo et nisl aliquam mollis. Quisque arcu lorem, ultricies quis pellentesque nec, ullamcorper eu odio.
Ethereum price is still struggling to gain pace above $1,670 and $1,680 against the US Dollar. ETH must stay above $1,620 to start another increase.
- Ethereum struggled to clear the $1,660 resistance.
- The price is trading above $1,635 and the 100-hourly Simple Moving Average.
- There is a key contracting triangle forming with resistance near $1,650 on the hourly chart of ETH/USD (data feed via Kraken).
- The pair must stay above the $1,620 support zone to start another increase in the short term.
Ethereum Price Faces Key Hurdle
Ethereum’s price remained well-supported above the $1,620 zone. ETH again climbed above the $1,650 resistance but struggled to clear $1,660, unlike Bitcoin.
The price made two attempts to gain strength above $1,660 but failed. A high was formed near $1,660 and the price started a downside correction. There was a move below the $1,650 level. The price declined below the 50% Fib retracement level of the recent increase from the $1,627 swing low to the $1,660 high.
Ether is now trading above $1,635 and the 100-hourly Simple Moving Average. It is also holding the 76.4% Fib retracement level of the recent increase from the $1,627 swing low to the $1,660 high.
On the upside, the price might face resistance near the $1,650 level. There is also a key contracting triangle forming with resistance near $1,650 on the hourly chart of ETH/USD. The next resistance is near the $1,660 level. The main resistance is now forming near $1,670.
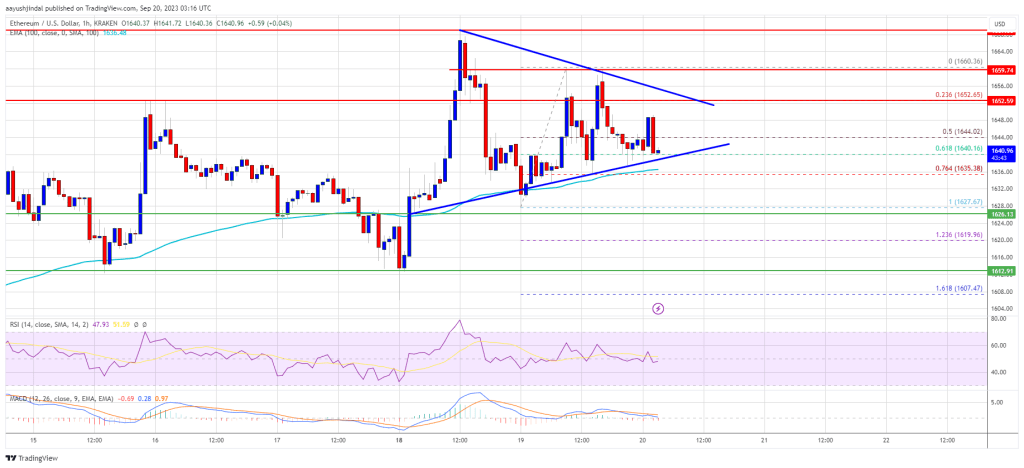
Source: ETHUSD on TradingView.com
A close above the $1,670 resistance might send the price toward the $1,750 resistance. The next major hurdle is near the $1,820 level. A close above the $1,820 level might send Ethereum further higher toward $1,950 in the coming days.
Downside Break in ETH?
If Ethereum fails to clear the $1,660 resistance, it could start another decline. Initial support on the downside is near the $1,635 level and the 100-hourly Simple Moving Average.
The first key support is close to $1,620. The next key support is $1,600. A clear move below $1,600 might increase selling pressure. In the stated case, the price could even decline toward the $1,540 level in the near term.
Technical Indicators
Hourly MACD – The MACD for ETH/USD is losing momentum in the bullish zone.
Hourly RSI – The RSI for ETH/USD is now below the 50 level.
Major Support Level – $1,620
Major Resistance Level – $1,660


