
Reason to trust
How Our News is Made
Strict editorial policy that focuses on accuracy, relevance, and impartiality
Ad discliamer
Morbi pretium leo et nisl aliquam mollis. Quisque arcu lorem, ultricies quis pellentesque nec, ullamcorper eu odio.
Ethereum gained bullish momentum above the $1,850 resistance against the US Dollar. ETH price is currently correcting lower from $1,945, but it might find bids near $1,850.
- Ethereum is in a positive zone and it recently climbed above the $1,900 resistance.
- The price is now well above the $1,850 support and the 100 hourly simple moving average.
- There is a short-term contracting triangle forming with support near $1,915 on the hourly chart of ETH/USD (data feed via Kraken).
- The pair could correct lower, but the bulls are likely to remain active above $1,850.
Ethereum Price Extends Gains
Ethereum started a fresh increase after it broke the $1,850 resistance, similar to bitcoin. ETH even surpassed the $1,920 resistance and settled nicely above the 100 hourly simple moving average.
However, the price struggled to continue higher above $1,945 and $1,950. There were two attempts to clear $1,945, but the bulls failed. A high is formed near $1,946 and the price is currently correcting lower. There was a break below the $1,920 support level.
The price is now approaching the $1,915 support. There is also a short-term contracting triangle forming with support near $1,915 on the hourly chart of ETH/USD.
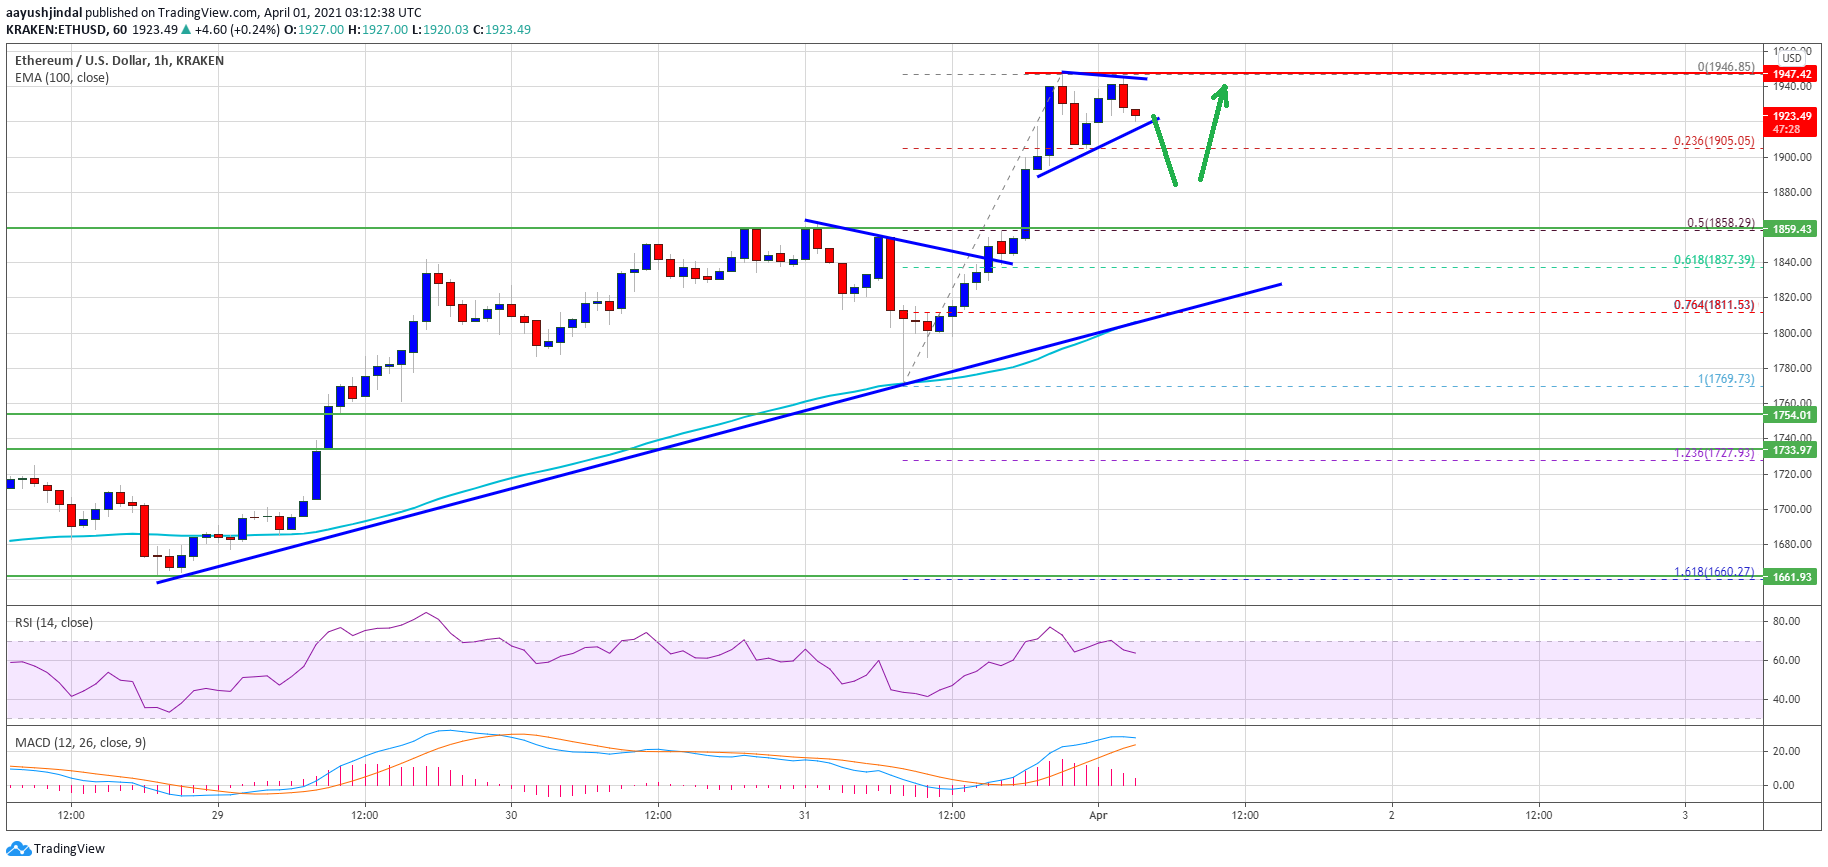
Source: ETHUSD on TradingView.com
If there is a downside break, the price could test the 23.6% Fib retracement level of the recent wave from the $1,769 swing low to $1,946 high. On the upside, the $1,945 and $1,950 levels are immediate hurdles. A clear break above the $1,950 resistance could clear the path for a test of the $2,000 level. Any more gains might call for a move towards the $2,045 level.
Dips Limited in ETH?
If Ethereum fails to climb above the $1,945 and $1,950 resistance levels, it could correct lower. An initial support on the downside is near the $1,905 level.
The first major support is near the $1,860 level. It is near the 50% Fib retracement level of the recent wave from the $1,769 swing low to $1,946 high. The main support is now forming near the $1,850 level (the recent breakout zone), below which ether price might decline towards the 100 hourly SMA at $1,800.
Technical Indicators
Hourly MACD – The MACD for ETH/USD is slowly losing momentum in the bullish zone.
Hourly RSI – The RSI for ETH/USD is now declining towards the 60 level.
Major Support Level – $1,850
Major Resistance Level – $1,950


