
Reason to trust
How Our News is Made
Strict editorial policy that focuses on accuracy, relevance, and impartiality
Ad discliamer
Morbi pretium leo et nisl aliquam mollis. Quisque arcu lorem, ultricies quis pellentesque nec, ullamcorper eu odio.
Ethereum price rallied over 15% and broke the $1,650 resistance against the US Dollar. ETH might correct lower and test the $1,625 support zone.
- Ethereum started a major increase above the $1,600 resistance zone.
- The price is trading above $1,620 and the 100 hourly simple moving average.
- There is a short-term breakout pattern forming with resistance near $1,700 on the hourly chart of ETH/USD (data feed via Kraken).
- The pair could correct lower, but dips might be limited below the $1,625 support.
Ethereum Price Climbs Over 15%
Ethereum price started a major increase above the $1,550 resistance zone. ETH gained pace for a move above the $1,600 resistance zone and the 100 hourly simple moving average, similar to bitcoin.
The price even spiked above the $1,680 resistance zone and tested the $1,700 region. A high is formed near $1,701 and the price is now consolidating gains. There is also a short-term breakout pattern forming with resistance near $1,700 on the hourly chart of ETH/USD.
Ether price is now trading above $1,620 and the 100 hourly simple moving average. It is consolidating gains and well trading above the 23.6% Fib retracement level of the upward wave from the $1,371 swing low to $1,701 high.
On the upside, the price is facing resistance near the $1,700 zone. The first major resistance is near the $1,740 zone. The next major resistance is near the $1,765 level.
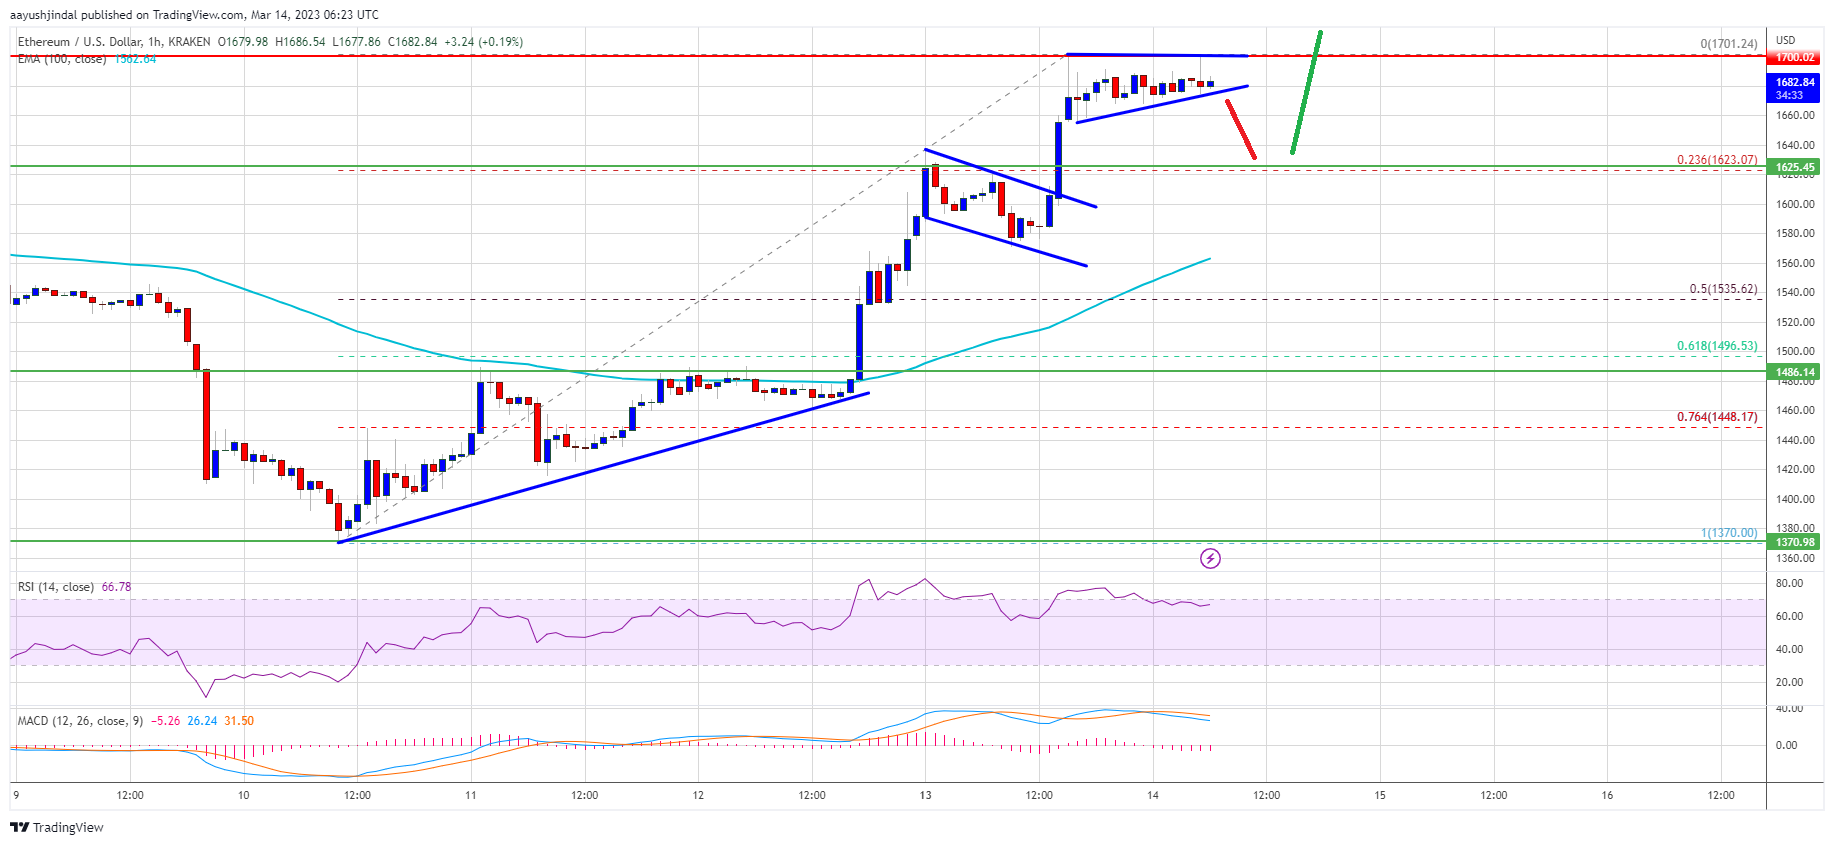
Source: ETHUSD on TradingView.com
A close above the $1,765 resistance zone might start another major increase. In this case, the price may perhaps rise towards the $1,850 resistance level. Any more gains might send the price towards $2,000.
Dips Limited in ETH?
If ethereum fails to clear the $1,700 resistance, it could start a downside correction. An initial support on the downside is near the $1,680 level.
The next major support is near the $1,625 zone. If there is a break below $1,625, the price might drop towards $1,535. It is near the 50% Fib retracement level of the upward wave from the $1,371 swing low to $1,701 high. Any more losses might call for a test of the $1,500 level.
Technical Indicators
Hourly MACD – The MACD for ETH/USD is now losing momentum in the bullish zone.
Hourly RSI – The RSI for ETH/USD is now above the 60 level.
Major Support Level – $1,625
Major Resistance Level – $1,700


