Reason to trust
How Our News is Made
Strict editorial policy that focuses on accuracy, relevance, and impartiality
Ad discliamer
Morbi pretium leo et nisl aliquam mollis. Quisque arcu lorem, ultricies quis pellentesque nec, ullamcorper eu odio.
Ethereum price spiked above $1,700 before correcting lower against the US Dollar. ETH is still well supported above the $1,600 zone and the 100 hourly SMA.
- Ethereum climbed above the $1,700 resistance before the bears took a stand.
- The price is still trading above $1,600 and the 100 hourly simple moving average.
- There is a major bullish trend line forming with support near $1,640 on the hourly chart of ETH/USD (data feed via Kraken).
- The pair could start another increase unless there is a clear move below the $1,600 support.
Ethereum Price Drops $100
Ethereum price attempted more gains above the $1,700 resistance zone. ETH spiked above the $1,700 level before the bears took a stand, similar to bitcoin.
A new weekly high was formed near $1,745 before there was a sharp decline. The price declined below the $1,700 and $1,680 levels. There was even a spike below the 50% Fib retracement level of the upward move from the $1,544 swing low to $1,745 high.
However, the bulls were active above the $1,620 support. Ether price is still trading above $1,600 and the 100 hourly simple moving average. There is also a major bullish trend line forming with support near $1,640 on the hourly chart of ETH/USD.
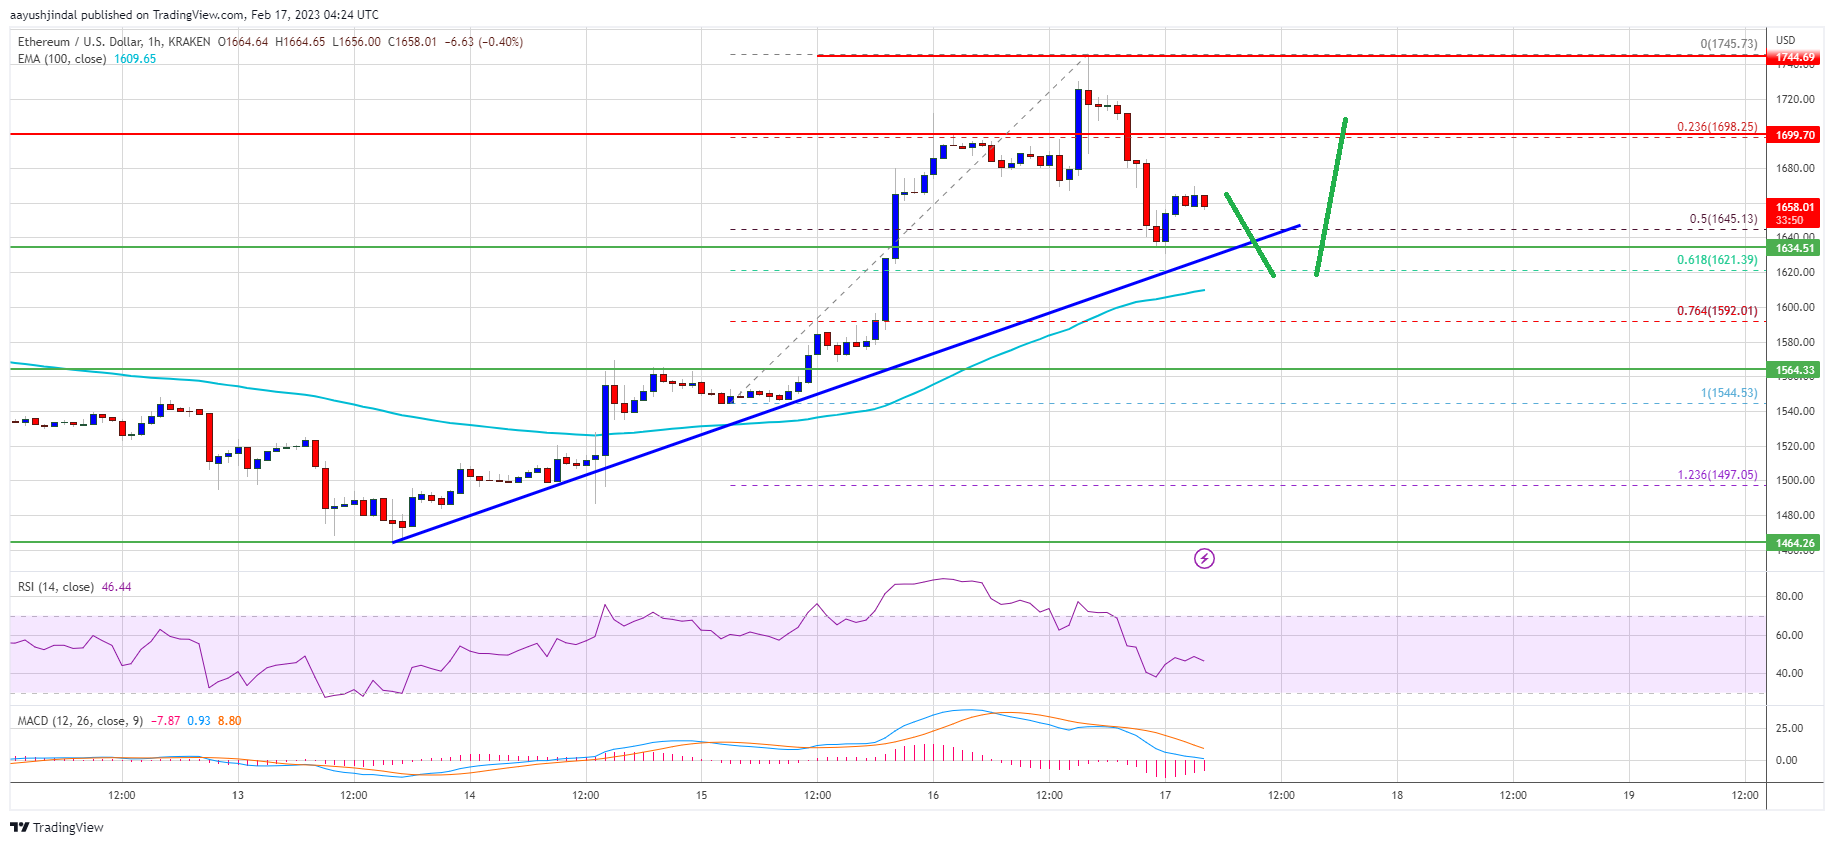
Source: ETHUSD on TradingView.com
On the upside, the price is facing resistance near the $1,680 level. The next major resistance is near the $1,700 zone. A proper close above the $1,700 resistance zone could start a steady increase. In the stated case, the price may perhaps rise towards the $1,780 resistance. The next major resistance is near the $1,840 level.
More Losses in ETH?
If ethereum fails to clear the $1,700 resistance, it could continue to move down. An initial support on the downside is near the $1,640 level and the trend line.
The next major support is near the $1,640 zone or the 100 hourly SMA or the 61.8% Fib retracement level of the upward move from the $1,544 swing low to $1,745 high. If there is a break below $1,600, the price might continue to drop and move towards the $1,565 support. Any more losses might call for a test of the $1,500 level.
Technical Indicators
Hourly MACD – The MACD for ETH/USD is now losing momentum in the bearish zone.
Hourly RSI – The RSI for ETH/USD is now below the 50 level.
Major Support Level – $1,640
Major Resistance Level – $1,700