
Reason to trust
How Our News is Made
Strict editorial policy that focuses on accuracy, relevance, and impartiality
Ad discliamer
Morbi pretium leo et nisl aliquam mollis. Quisque arcu lorem, ultricies quis pellentesque nec, ullamcorper eu odio.
Ethereum started a downside correction from a new all-time high at $1,697 against the US Dollar. ETH price is holding gains above $1,600 and it could start a fresh increase.
- Ethereum started a downside correction below the $1,650 and $1,620 levels.
- The price is still trading well above $1,600 and the 100 hourly simple moving average.
- There is a key contracting triangle forming with resistance near $1,655 on the hourly chart of ETH/USD (data feed via Kraken).
- The pair is likely to resume higher once it clears the $1,655 and $1,660 resistance levels in the near term.
Ethereum Price Remains Steady
After setting a new all-time high near $1,697, Ethereum started a short-term downside correction. ETH traded below the $1,650 and $1,620 support levels. There was also a spike below the $1,600 level, but the price recovered quickly.
Ether is now trading well above $1,600 and the 100 hourly simple moving average. The recent swing low was formed near $1,589 before the price climbed above $1,620.
There was a break above the 50% Fib retracement level of the recent decline from the $1,672 high to $1,589 low. It seems like there is a key contracting triangle forming with resistance near $1,655 on the hourly chart of ETH/USD.
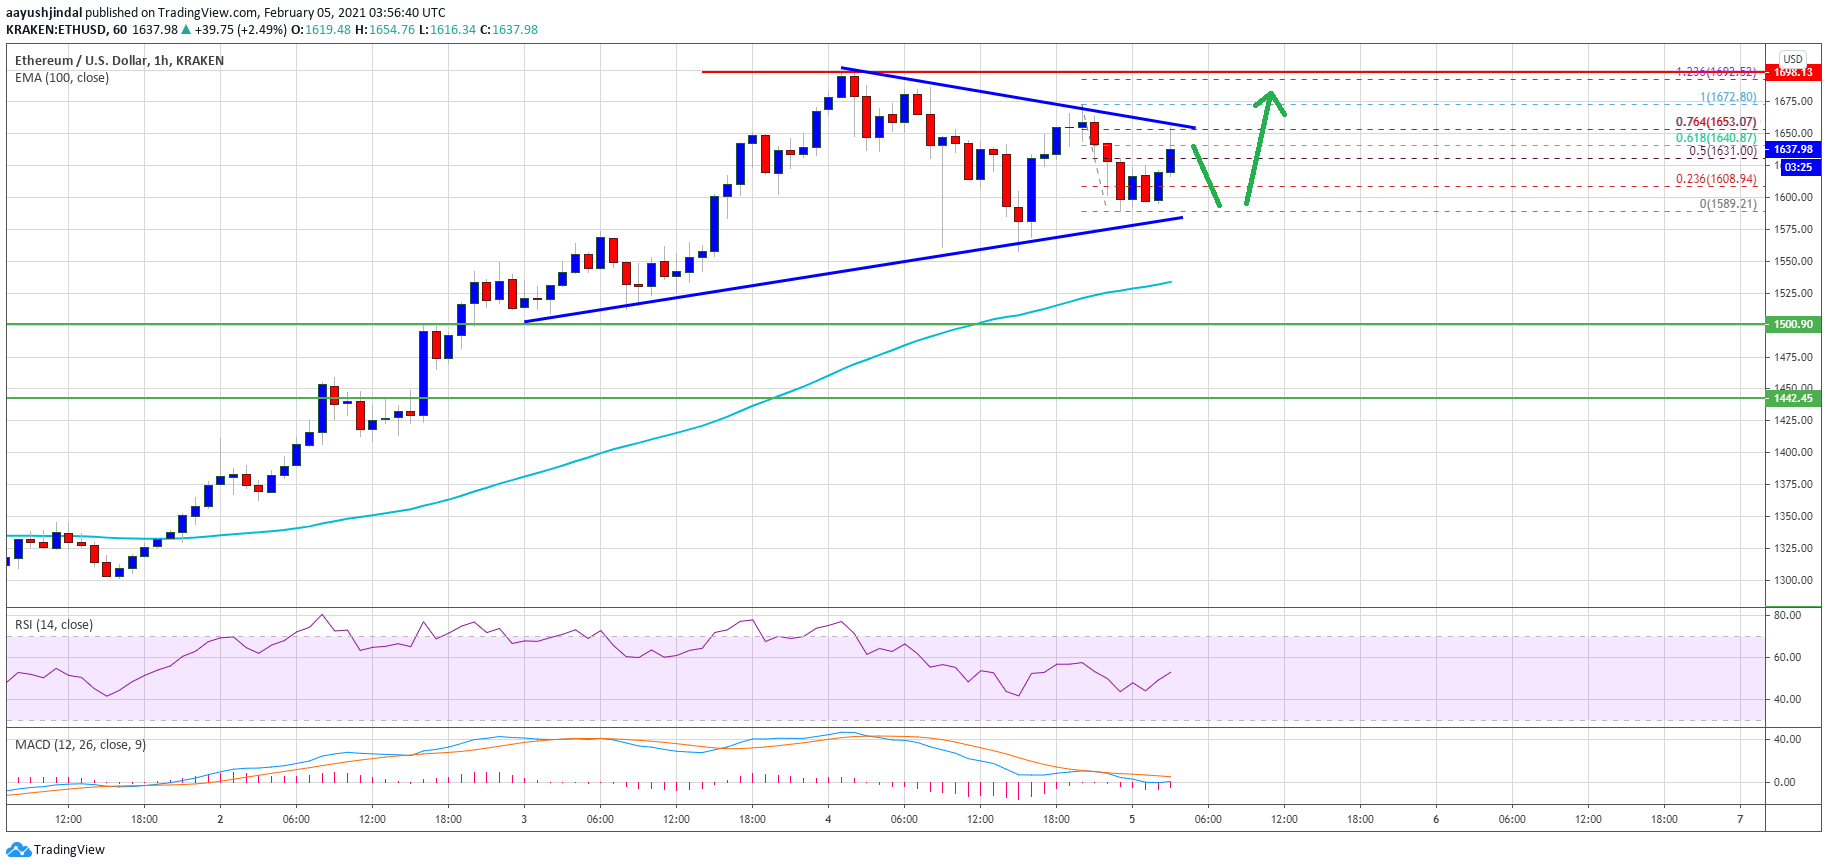
Source: ETHUSD on TradingView.com
The triangle resistance is close to the 76.4% Fib retracement level of the recent decline from the $1,672 high to $1,589 low. If there is a close above the triangle resistance at $1,655 and $1,660, ether price might start a fresh increase.
In the stated case, it could even surpass the $1,700 level in the near term. The next major resistance for the bulls above $1,700 might be $1,735 (a key fib extension level).
Are you holding ETH? There’s a brand new real-time notification system which alerts you of incoming/outgoing transactions from any address or token contract, offered by Ethplorer. The company’s Watching Service automatically monitors addresses you select and sends you a real-time notification whenever that address performs a transaction. You can choose to monitor incoming transactions, outgoing transactions, or both. Also, the Watching Service allows you to track all transactions at a specific address or even a smart contract. The depth of measurement makes this tool unique, since no other service allows you to do something similar
Dips Supported in ETH?
If Ethereum fails to clear the $1,655 resistance level and the triangle upper trend line, it could correct further lower. On the downside, an initial support is near the triangle lower trend line at $1,585.
A downside break below the triangle support could push the price towards the $1,550 support zone. Any more losses is likely to lead the price towards the $1,500 support region in the coming sessions.
Technical Indicators
Hourly MACD – The MACD for ETH/USD is slowly gaining momentum in the bullish zone.
Hourly RSI – The RSI for ETH/USD is currently just above the 50 level.
Major Support Level – $1,585
Major Resistance Level – $1,660


