
Reason to trust
How Our News is Made
Strict editorial policy that focuses on accuracy, relevance, and impartiality
Ad discliamer
Morbi pretium leo et nisl aliquam mollis. Quisque arcu lorem, ultricies quis pellentesque nec, ullamcorper eu odio.
Ethereum started a steady increase above $3,050 against the US Dollar. ETH price could correct lower, but the bulls might remain active near $3,000 and $2,950.
- Ethereum extended its increase above the $3,100 and $3,150 levels.
- The price is now trading near $3,100 and near the 100 hourly simple moving average.
- There was a break below a key bullish trend line with support near $3,150 on the hourly chart of ETH/USD (data feed via Kraken).
- The pair could correct lower towards $3,000 or even $2,950 in the near term.
Ethereum Price Is Losing Pace
Ethereum started a steady increase and settled above the $3,000 level. ETH even broke the $3,100 level and settled above the 100 hourly simple moving average.
It traded as high as $3,173 and recently corrected lower. There was a break below the $3,150 level. Besides, there was a break below a key bullish trend line with support near $3,150 on the hourly chart of ETH/USD.
Ether is now trading near $3,100 and near the 100 hourly simple moving average. It is still trading well above the 23.6% Fib retracement level of the upward move from the $2,651 swing low to $3,173 high. An immediate resistance on the upside is near the $3,150 level.
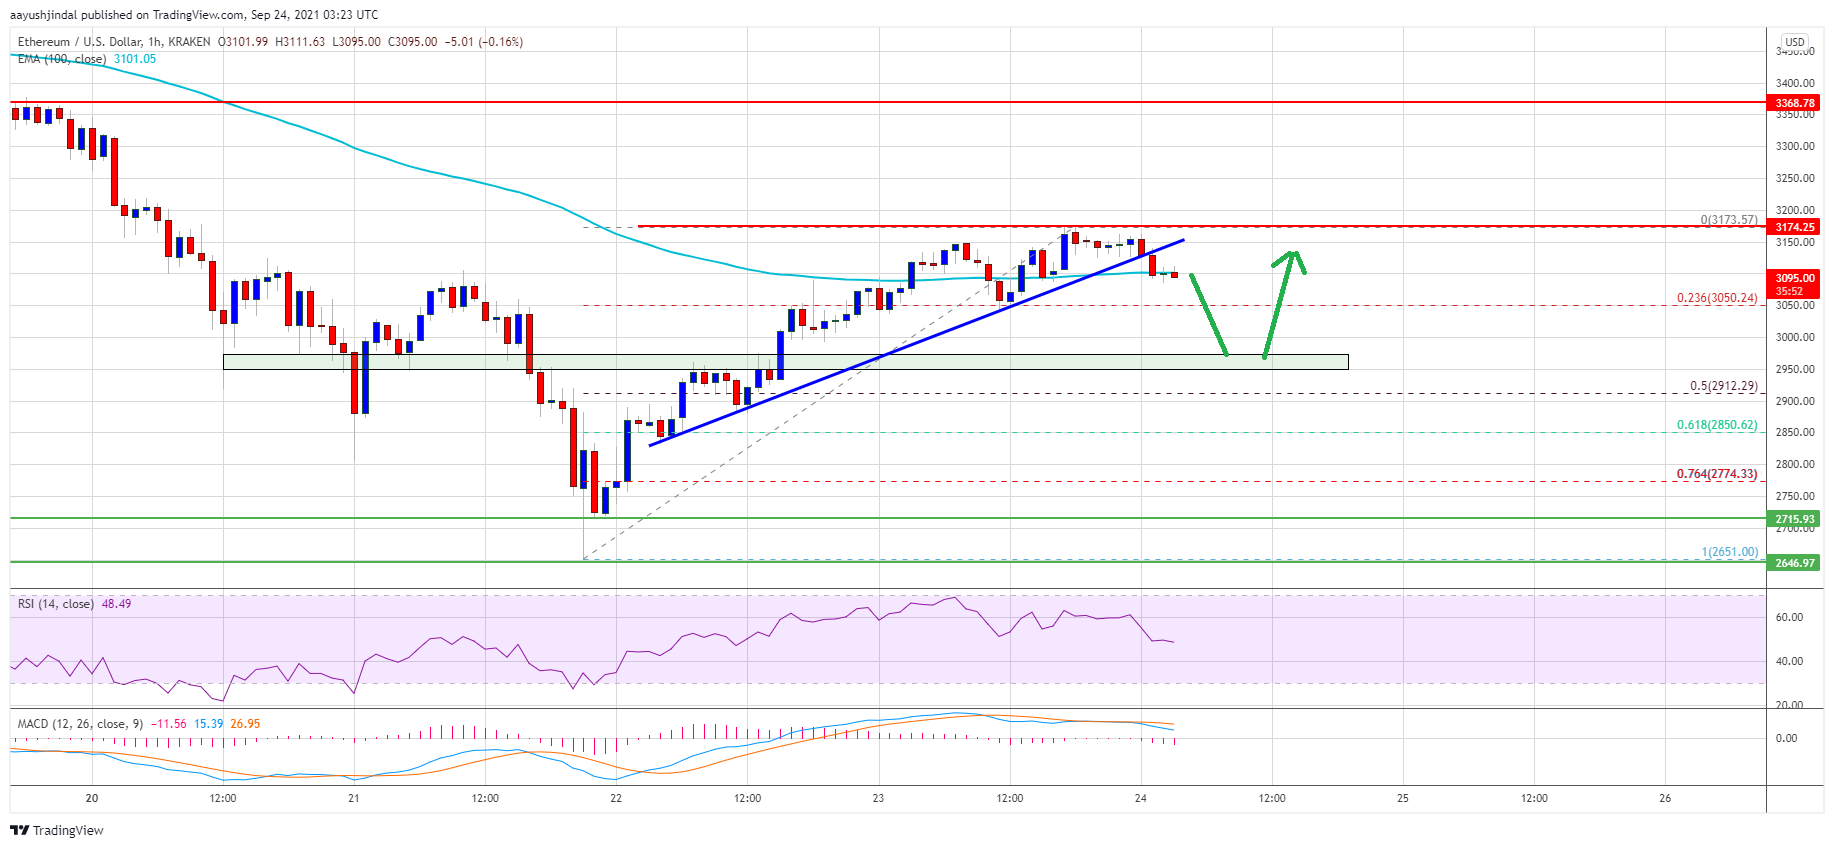
Source: ETHUSD on TradingView.com
The first major resistance is near the $3,180 level. The main breakout zone could be near the $3,200 zone. A close above the $3,200 resistance could start another steady increase. The next major resistance might be near the $3,320 level. Any more gains may possibly open the doors for a move towards the $3,500 level in the near term.
Dips Limited in ETH?
If ethereum fails to continue higher above the $3,150 and $3,200 resistance levels, it could start a downside correction. An initial support on the downside is near the $3,050 level.
The next major support seems to be forming near the $2,950 level. Any more losses might call for a test of the 50% Fib retracement level of the upward move from the $2,651 swing low to $3,173 high at $2,912. A downside break below the $2,900 support zone could put a lot of pressure on the bulls.
Technical Indicators
Hourly MACD – The MACD for ETH/USD is slowly losing pace in the bullish zone.
Hourly RSI – The RSI for ETH/USD is now close to the 50 level.
Major Support Level – $3,050
Major Resistance Level – $3,200


