
Reason to trust
How Our News is Made
Strict editorial policy that focuses on accuracy, relevance, and impartiality
Ad discliamer
Morbi pretium leo et nisl aliquam mollis. Quisque arcu lorem, ultricies quis pellentesque nec, ullamcorper eu odio.
Ethereum is trading in a positive zone above the $2,400 support zone the 100 hourly SMA against the US Dollar. ETH price is likely to rally if there is a clear break above $2,500.
- Ethereum is trading in a positive zone above the $2,400 and $2,420 support levels.
- The price is now trading above $2,450 and the 100 hourly simple moving average.
- There was a break above a major bearish trend line with resistance near $2,400 on the hourly chart of ETH/USD (data feed via Kraken).
- The pair could correct lower, but the price is likely to remain well bid above $2,400.
Ethereum Price Is Showing Positive Signs
After forming a base above $2,350, ethereum started a steady increase. ETH broke the $2,400 resistance zone and it settled nicely above the 100 hourly simple moving average.
However, ether struggled to gain pace similar to bitcoin. It climbed above the $2,450 and $2,500 resistance. There was also a break above a major bearish trend line with resistance near $2,400 on the hourly chart of ETH/USD.
The pair tested the $2,550 resistance and it is now correcting gains. It traded below the 23.6% Fib retracement level of the upward move from the $2,311 swing low to $2,554 high. Ether is now trading above $2,450 and the 100 hourly simple moving average.
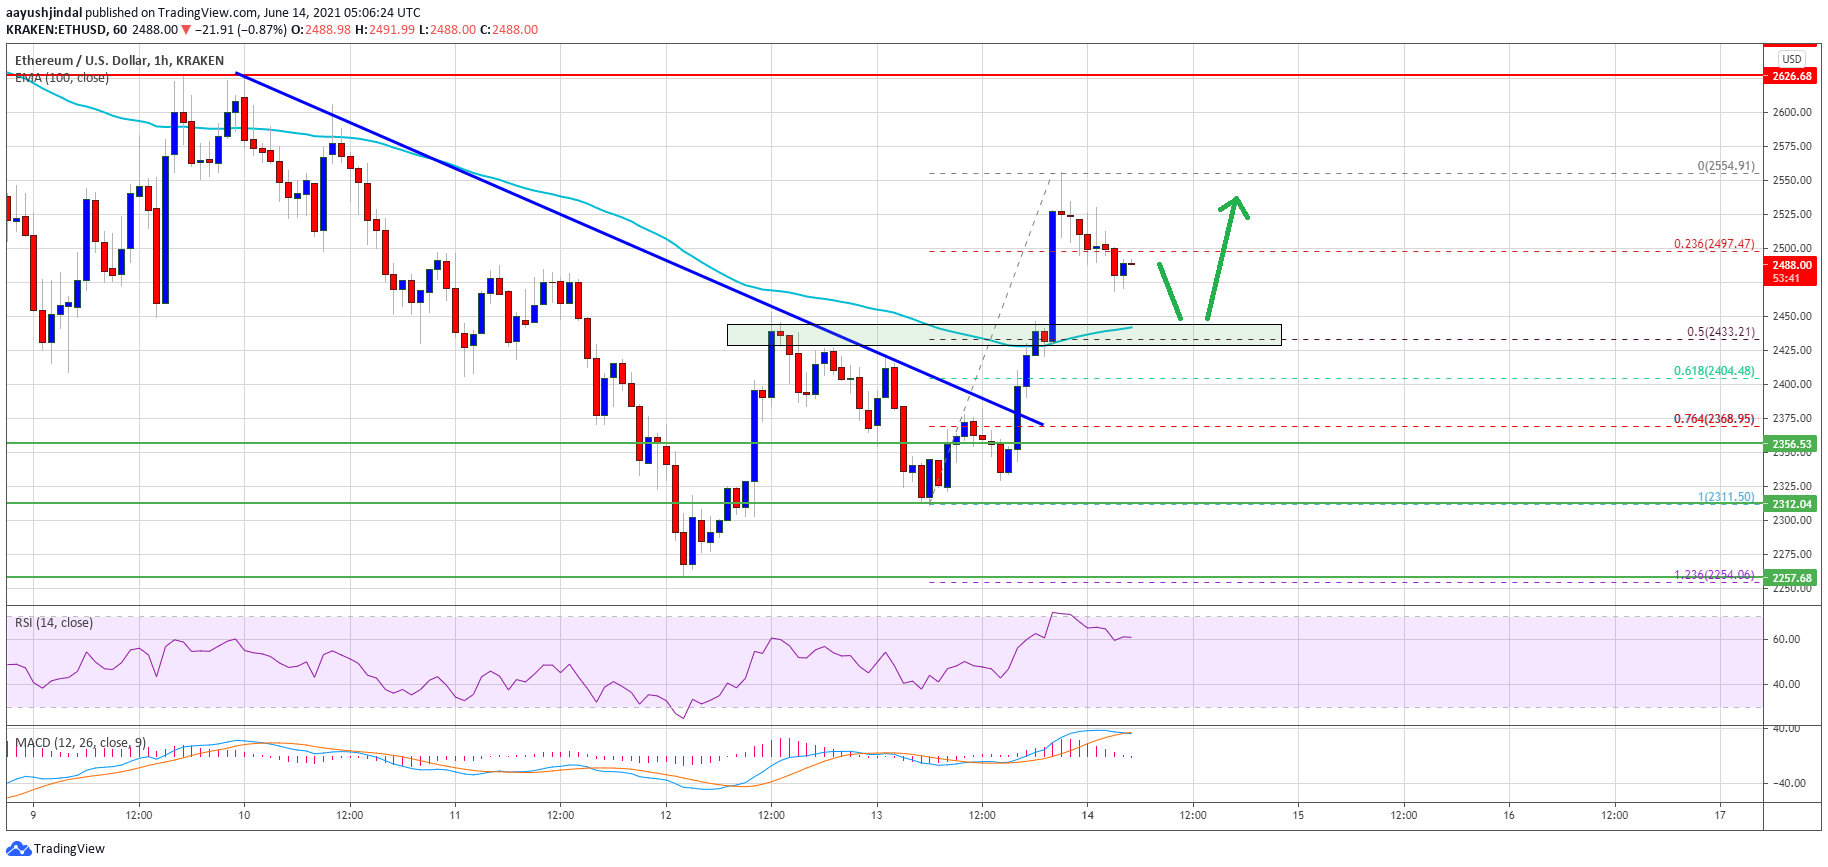
Source: ETHUSD on TradingView.com
The first major support on the downside is near the $2,440 level. It is near the 50% Fib retracement level of the upward move from the $2,311 swing low to $2,554 high. On the upside, the price is facing resistance near the $2,520 level.
The main breakout resistance is now forming near the $2,550 level. A close above the $2,550 level could start a major increase towards the $2,680 level or even $2,750 in the near term.
Dips Supported in ETH?
If Ethereum fails to clear the $2,520 and $2,550 resistance levels, it could start a downside correction. An initial support on the downside is near the $2,450 level.
The main support is now forming near the $2,440 level and the 100 hourly SMA. A downside break below $2,450 may possibly put a lot of pressure on the bulls. The next key support is near the $2,400 level.
Technical Indicators
Hourly MACD – The MACD for ETH/USD is slowly losing pace in the bullish zone.
Hourly RSI – The RSI for ETH/USD is currently above the 50 level.
Major Support Level – $2,440
Major Resistance Level – $2,550


