
Reason to trust
How Our News is Made
Strict editorial policy that focuses on accuracy, relevance, and impartiality
Ad discliamer
Morbi pretium leo et nisl aliquam mollis. Quisque arcu lorem, ultricies quis pellentesque nec, ullamcorper eu odio.
Ethereum started a fresh increase from the $480 support zone against the US Dollar. ETH price must surpass $550 to start a strong upward move towards $600.
- ETH price declined heavily from $620 and it even tested $480 against the US Dollar.
- The price is currently recovering above $500 and the 100 simple moving average (4-hours).
- There is a key bearish trend line forming with resistance near $550 on the 4-hours chart of ETH/USD (data feed via Kraken).
- The pair could rise sharply towards $580 and $600 if it clears the $550 resistance.
Ethereum Price is Approaching Next Break
This past week, bitcoin and ethereum saw a sharp downside correction below $17,000 and $550 respectively against the US Dollar. ETH price even spiked below the $500 support and the 100 simple moving average (4-hours).
It tested the $480 support level and formed a support base for a fresh increase. Ether recovered above the $500 level and the 100 simple moving average (4-hours). The price even climbed above the 23.6% Fib retracement level of the downside correction from the $620 swing high to $480 swing low.
The price is now approaching a major resistance area near $550. There is also a key bearish trend line forming with resistance near $550 on the 4-hours chart of ETH/USD.
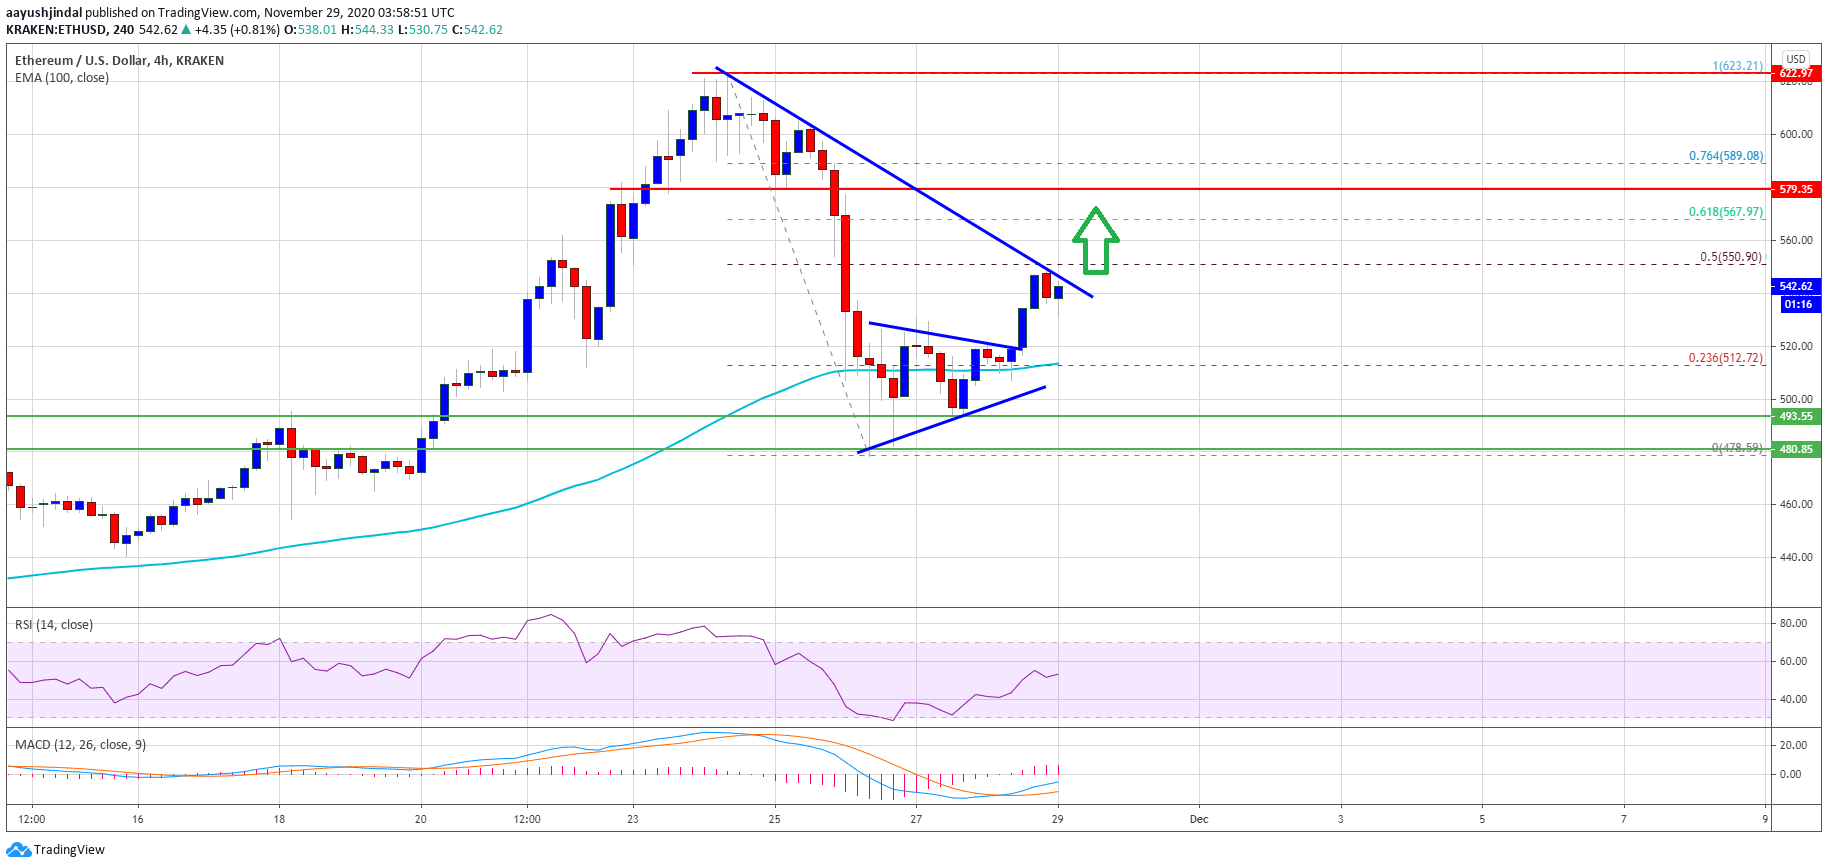
Source: ETHUSD on TradingView.com
The 50% Fib retracement level of the downside correction from the $620 swing high to $480 swing low is also near the $550 level to act as a major resistance. A successful break above the $550 level could spark a strong upward move.
The next key resistance is near the $580 level. If ether clears the $580 resistance, it could even retest or surpass the $600 resistance level in the coming sessions.
Fresh Decline in Ether (ETH)?
If Ethereum fails to extend its rise above $550, it could start another downward move. The first major support zone sits near the $520 level.
The 100 simple moving average (4-hours) is also near the $512 level to act as a major support. A downside break below the $512 level and $500 might put ether at a risk of more losses below $480.
Technical Indicators
4 hours MACD – The MACD for ETH/USD is slowly gaining momentum in the bullish zone.
4 hours RSI – The RSI for ETH/USD is now above the 50 level, but showing a few bearish signs.
Major Support Level – $512
Major Resistance Level – $550


