
Reason to trust
How Our News is Made
Strict editorial policy that focuses on accuracy, relevance, and impartiality
Ad discliamer
Morbi pretium leo et nisl aliquam mollis. Quisque arcu lorem, ultricies quis pellentesque nec, ullamcorper eu odio.
Ethereum faced a strong rejection above $380 against the US Dollar. ETH price is now at a risk of a sharp decline if it breaks the key $365 support in the near term.
- Ethereum struggled to gain momentum above the $380 and $382 levels.
- The price declined sharply below the 100 hourly simple moving average, and retested $365.
- There is a key bearish trend line forming with resistance near $378 on the hourly chart of ETH/USD (data feed via Kraken).
- The pair could decline heavily if there is a clear break below the $365 support level.
Ethereum Price Showing Bearish Signs
Ethereum started a steady decline from well above the $385 level. ETH price faced a strong resistance near the $380 and $382 levels, resulting in a drop below the $375 support.
Ether price even broke the $370 support and settled well below the 100 hourly simple moving average. It retested the key $365 support level and it is currently consolidating losses. An initial resistance is near the $372 level.
The first major resistance is near the $374 level or the 50% Fib retracement level of the recent decline from the $382 high to $365 low. More importantly, there is a key bearish trend line forming with resistance near $378 on the hourly chart of ETH/USD.
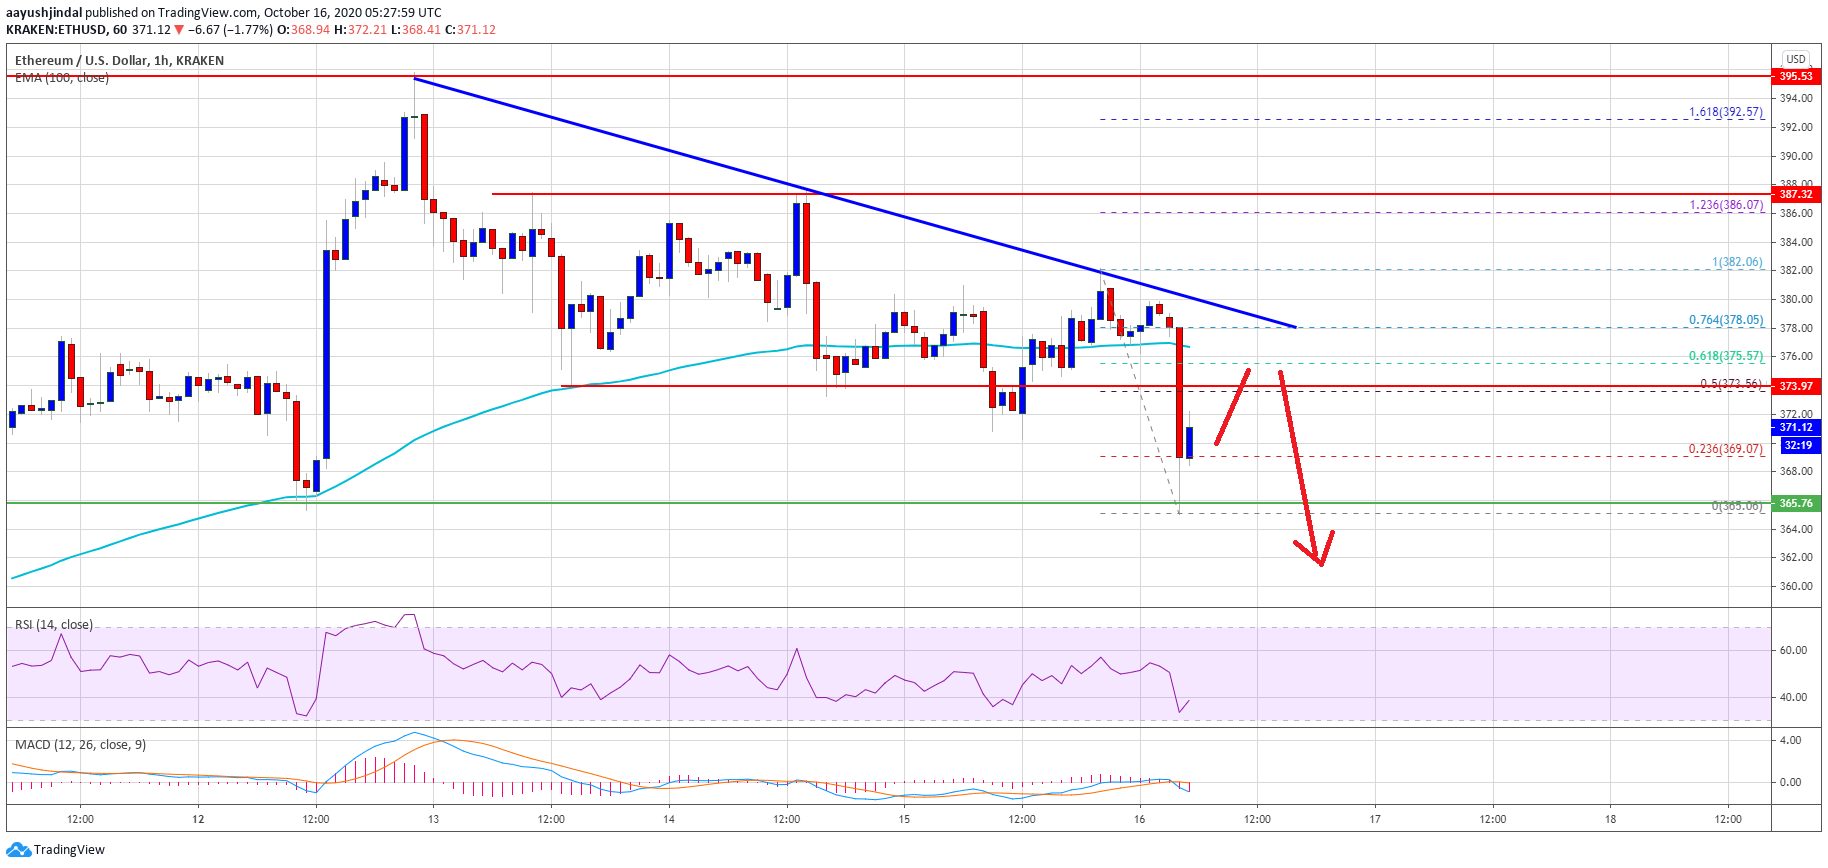
Source: ETHUSD on TradingView.com
The trend line is close to the 100 hourly simple moving average and the 76.4% Fib retracement level of the recent decline from the $382 high to $365 low. If there is no recovery above $374 and $378, there is a risk of a downside break below the $365 support.
A proper close below the $365 support may perhaps open the doors for a larger decline. The next major support is near the $355 level.
Fresh Increase in ETH?
If Ethereum stays above the $365 support, it could start a fresh increase. The first key resistance is near the $374 level, but the main hurdle is now forming near $378.
A clear break above the trend line resistance, $378, and the 100 hourly simple moving average could open the doors for a steady rise towards the $388 and $392 levels in the coming sessions.
Technical Indicators
Hourly MACD – The MACD for ETH/USD is now gaining pace in the bearish zone.
Hourly RSI – The RSI for ETH/USD is now well below the 50 level.
Major Support Level – $365
Major Resistance Level – $374


