
Reason to trust
How Our News is Made
Strict editorial policy that focuses on accuracy, relevance, and impartiality
Ad discliamer
Morbi pretium leo et nisl aliquam mollis. Quisque arcu lorem, ultricies quis pellentesque nec, ullamcorper eu odio.
Polkadot’s DOT started a strong surge after it broke the $10.00 resistance against the US Dollar. It is up over 35% this week, and it outperformed bitcoin.
- DOT gained pace above the $9.50 and $10.00 resistance levels against the US dollar.
- The price traded to a new yearly high at $11.60 and settled well above the 100 simple moving average (4-hours).
- There was a break above a key bearish trend line with resistance near $9.35 on the 4-hours chart of the DOT/USD pair (data source from Kraken).
- The pair could correct lower, but the previous resistance at $10.50 might provide support.
Polkadot’s DOT Rallies Above $11
After testing the $7.20 zone, DOT started a fresh increase above the $8.50 resistance level. The bulls gained strength, resulting in a solid push above the $9.00 pivot level.
There was a clear break above a key bearish trend line with resistance near $9.35 on the 4-hours chart of the DOT/USD pair. It opened the doors for a steady increase above the $10.00 level. The bulls pushed the price above the 76.4% Fib retracement level of the downward move from the $10.71 swing high to $7.18 low.
It even broke the last swing high near $10.71 and settled well above the 100 simple moving average (4-hours). Finally, there was a break above $11.00 and the price tested the $11.60 zone.
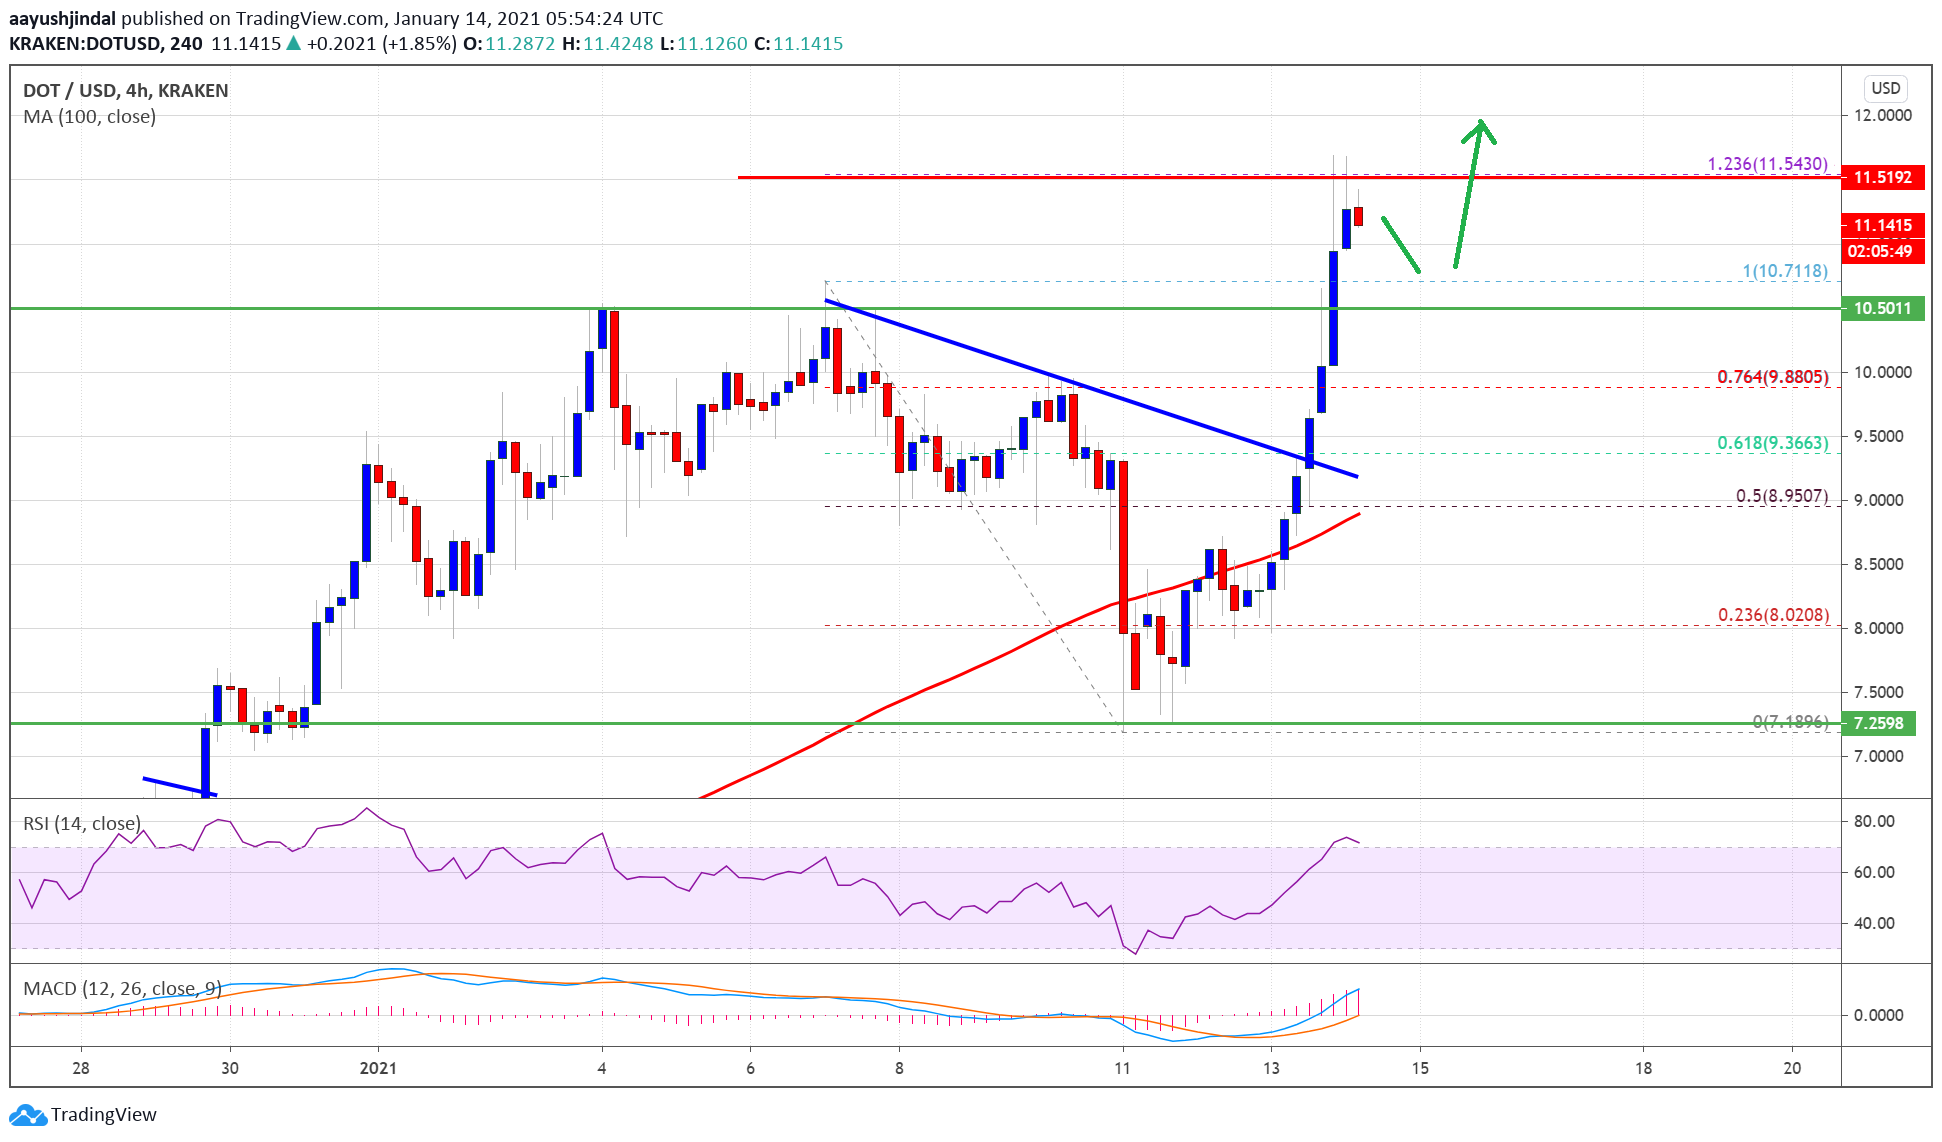
Source: DOTUSD on TradingView.com
It seems like the price is facing hurdles near $11.50-$11.60. It represents the 1.236 Fib extension level of the downward move from the $10.71 swing high to $7.18 low. It seems like there could be a downside correction from the $11.50 level.
On the downside, the previous breakout zone near the $10.70 and $10.50 levels could act as a strong support. Any more losses could lead the price towards the $9.00 support zone.
More Upsides?
If DOT price starts a fresh increase, it could easily clear the $11.50 and $11.60 resistance levels. The next major resistance on the upside could be near the $12.00 level.
A close above the $12.00 may possibly open the doors for a sustained upward move. In the stated case, the bulls might aim a test of the $15.00 level.
Technical Indicators
4-Hours MACD – The MACD for DOT/USD is gaining momentum in the bullish zone.
4-Hours RSI (Relative Strength Index) – The RSI for DOT/USD is now well above the 60 level.
Major Support Levels – $11.00, $10.70 and $10.50.
Major Resistance Levels – $11.50, $11.60 and $12.00.


