
Reason to trust
How Our News is Made
Strict editorial policy that focuses on accuracy, relevance, and impartiality
Ad discliamer
Morbi pretium leo et nisl aliquam mollis. Quisque arcu lorem, ultricies quis pellentesque nec, ullamcorper eu odio.
Dogecoin started a fresh decline from the $0.1085 resistance against the US Dollar. DOGE is struggling and might soon test the $0.0980 support.
- DOGE price is gaining bearish momentum below $0.1035.
- The price is trading below the $0.1020 level and the 100-hourly simple moving average.
- There is a key bearish trend line forming with resistance at $0.1050 on the hourly chart of the DOGE/USD pair (data source from Kraken).
- The price could extend losses and revisit the key support at $0.0980.
Dogecoin Price Extends Losses
After a steady increase, Dogecoin price faced sellers near the $0.1085 level. The price formed a short-term top and started another decline below the $0.1050 level like Bitcoin and Ethereum.
There was a move below the $0.1035 support zone. The price dipped below the 50% Fib retracement level of the upward move from the $0.0978 swing low to the $0.1084 high. There is also a key bearish trend line forming with resistance at $0.1050 on the hourly chart of the DOGE/USD pair.
Dogecoin price is now trading below the $0.1035 level and the 100-hourly simple moving average. It is also testing the 76.4% Fib retracement level of the upward move from the $0.0978 swing low to the $0.1084 high.
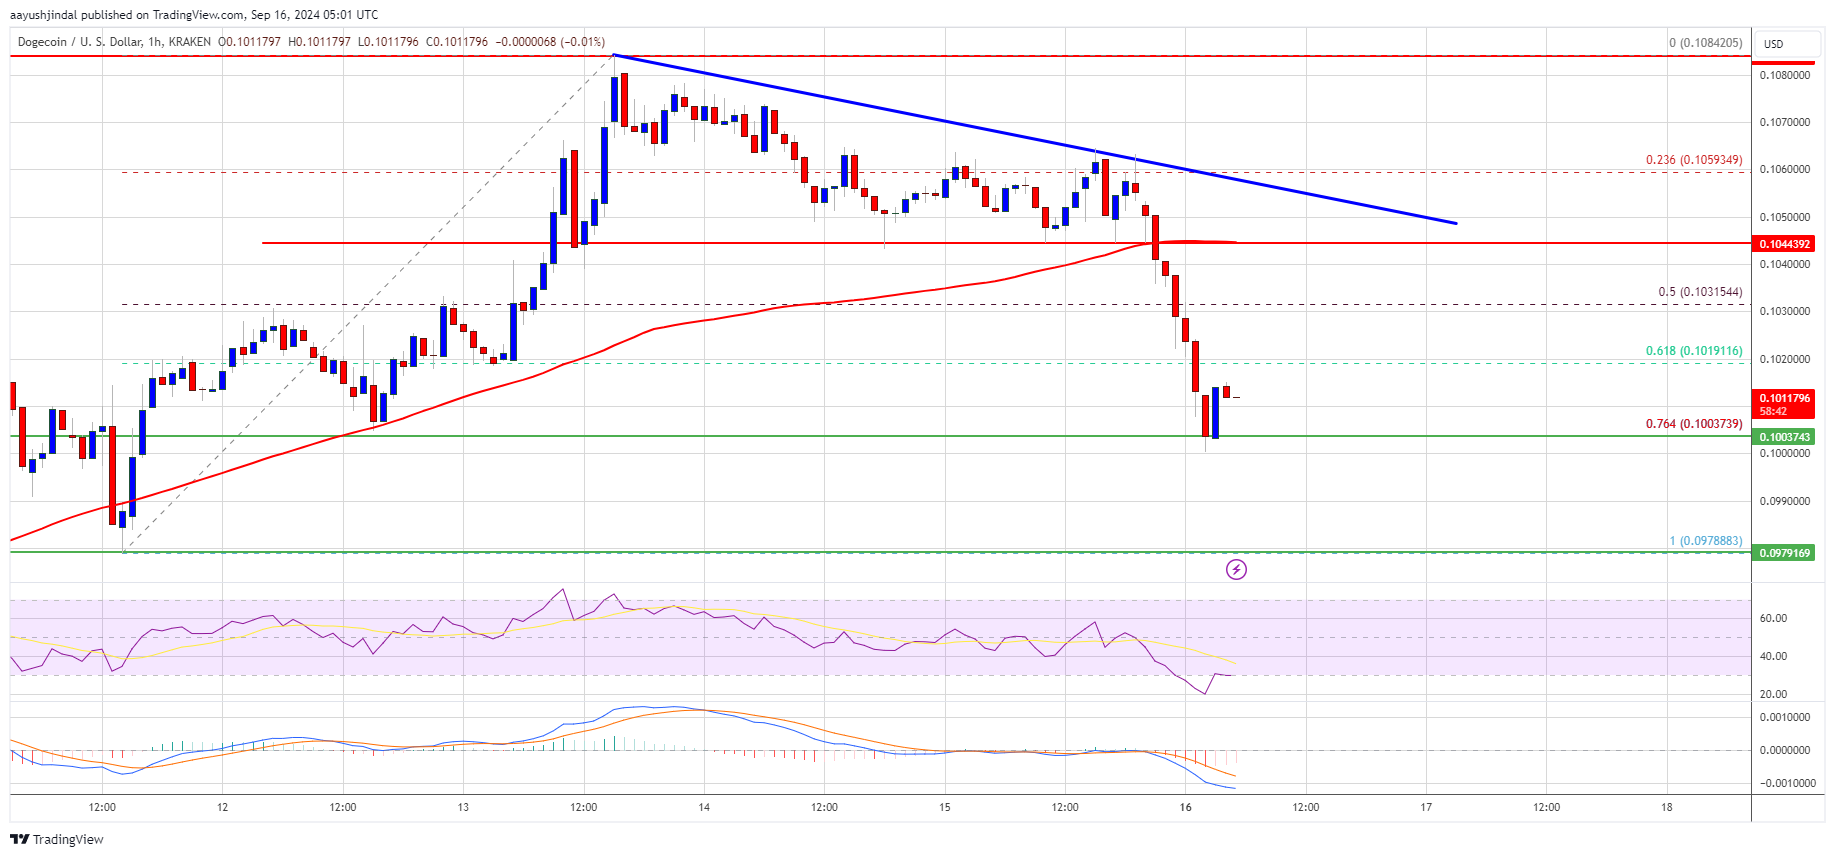
Immediate resistance on the upside is near the $0.1032 level. The next major resistance is near the $0.1045 level. A close above the $0.1045 resistance might send the price toward the $0.1050 resistance. Any more gains might send the price toward the $0.1085 level. The next major stop for the bulls might be $0.1120.
More Downsides In DOGE?
If DOGE’s price fails to climb above the $0.1035 level, it could start another decline. Initial support on the downside is near the $0.1000 level. The next major support is near the $0.0980 level.
The main support sits at $0.0918. If there is a downside break below the $0.0918 support, the price could decline further. In the stated case, the price might decline toward the $0.0880 level or even $0.0850 in the near term.
Technical Indicators
Hourly MACD – The MACD for DOGE/USD is now gaining momentum in the bearish zone.
Hourly RSI (Relative Strength Index) – The RSI for DOGE/USD is now below the 50 level.
Major Support Levels – $0.0980 and $0.0918.
Major Resistance Levels – $0.1035 and $0.1050.


