
Reason to trust
How Our News is Made
Strict editorial policy that focuses on accuracy, relevance, and impartiality
Ad discliamer
Morbi pretium leo et nisl aliquam mollis. Quisque arcu lorem, ultricies quis pellentesque nec, ullamcorper eu odio.
Bitcoin price struggled to gain momentum above $10,400 against the US Dollar. BTC is currently trading near the $10,000 support and remains at a risk of a sharp decline.
- Bitcoin is currently struggling to stay above the $10,000 and $9,900 support levels.
- The price is now facing a major hurdle near $10,200 and the 100 hourly simple moving average.
- There is a new declining channel forming with resistance near $10,150 on the hourly chart of the BTC/USD pair (data feed from Kraken).
- The pair could decline heavily if it settles below the recent swing low at $9,860.
Bitcoin Price Remains At Risk
Yesterday, we saw a few positive signs above $10,200 for bitcoin price against the US Dollar. However, BTC struggled to gain bullish momentum above the $10,300 and $10,400 levels.
It declined below the $10,200 support and settled below the 100 hourly simple moving average. It is now struggling to stay above the $10,000 and $9,900 support levels. An initial resistance on the upside is near the $10,120 level.
The 50% Fib retracement level of the recent decline from the $10,419 high to $9,855 low is also acting as a resistance. More importantly, there is a new declining channel forming with resistance near $10,150 on the hourly chart of the BTC/USD pair.
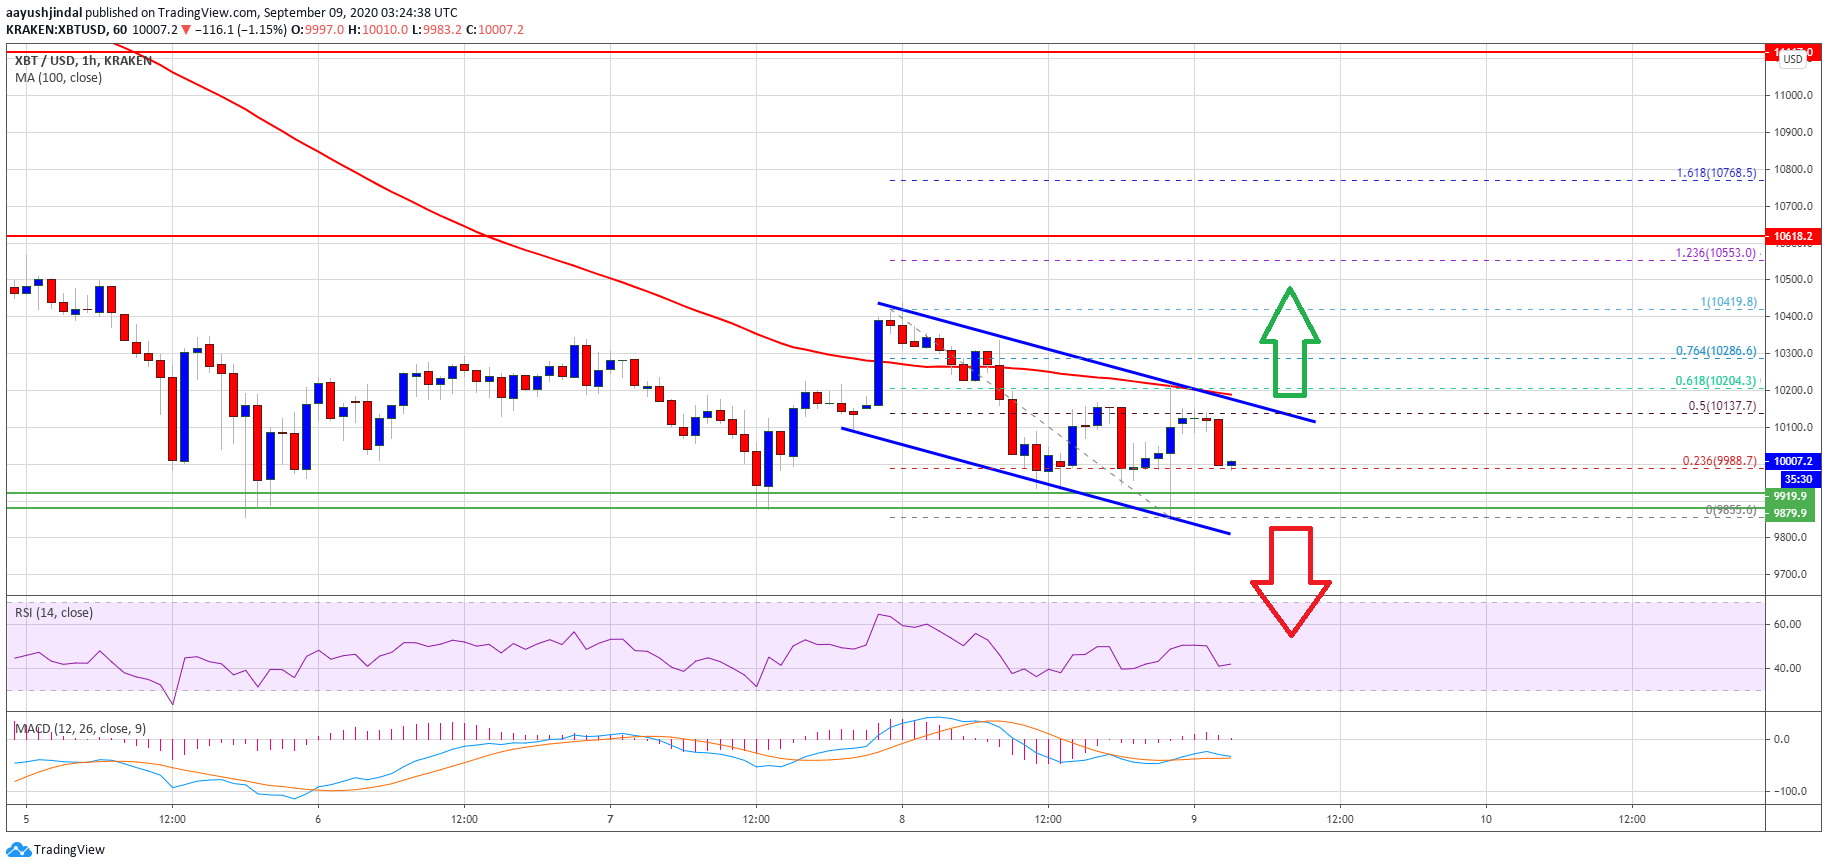
Bitcoin price trades near $10,000. Source: TradingView.com
The main resistance is near the $10,200 level and the 100 hourly SMA. It coincides with the 61.8% Fib retracement level of the recent decline from the $10,419 high to $9,855 low.
To avoid a sharp decline, the price must break the channel resistance and then gain strength above the $10,200 level. The next major resistance is near the $10,400 level, above which the bulls might attempt a clear break above the $10,500 resistance.
Sharp Decline in BTC?
If bitcoin fails to clear the $10,200 resistance, there is a risk of a massive decline. The main breakdown support is near the $9,900 and $9,850 levels.
A close below the $9,850 support could start a sharp decline. In the stated case, the price might decline heavily towards the $9,500 and $9,200 in the near term.
Technical indicators:
Hourly MACD – The MACD is struggling to gain momentum in the bullish zone.
Hourly RSI (Relative Strength Index) – The RSI for BTC/USD is currently just above the 40 level.
Major Support Levels – $9,900, followed by $9,850.
Major Resistance Levels – $10,150, $10,200 and $10,400.


