
Reason to trust
How Our News is Made
Strict editorial policy that focuses on accuracy, relevance, and impartiality
Ad discliamer
Morbi pretium leo et nisl aliquam mollis. Quisque arcu lorem, ultricies quis pellentesque nec, ullamcorper eu odio.
Bitcoin price made another attempt to clear $35,000, but it failed against the US Dollar. BTC is currently consolidating above the $33,000 support zone, with a few positive signs.
- Bitcoin is still facing a strong resistance near the $34,850 and $35,000 levels.
- The price is currently holding the key $33,000 support level and testing the 100 hourly simple moving average.
- There is a key contracting triangle forming with resistance near $34,500 on the hourly chart of the BTC/USD pair (data feed from Kraken).
- The pair could make another attempt to surpass $35,000 if it clears the $34,500 resistance level.
Bitcoin Price Is Stuck Below $35,000
After a strong surge, bitcoin price trimmed most its gains and settled below $35,000. BTC even spiked below the $34,000 support level and the 100 hourly simple moving average.
A low is formed near $32,178 and the price is currently correcting higher. There was a break above the 23.6% downward move from the $38,590 swing high to $32,178 low. Bitcoin is now holding the key $33,000 support level and testing the 100 hourly simple moving average.
It seems like there is a key contracting triangle forming with resistance near $34,500 on the hourly chart of the BTC/USD pair. The next major resistance above the triangle is near the $34,850 level.
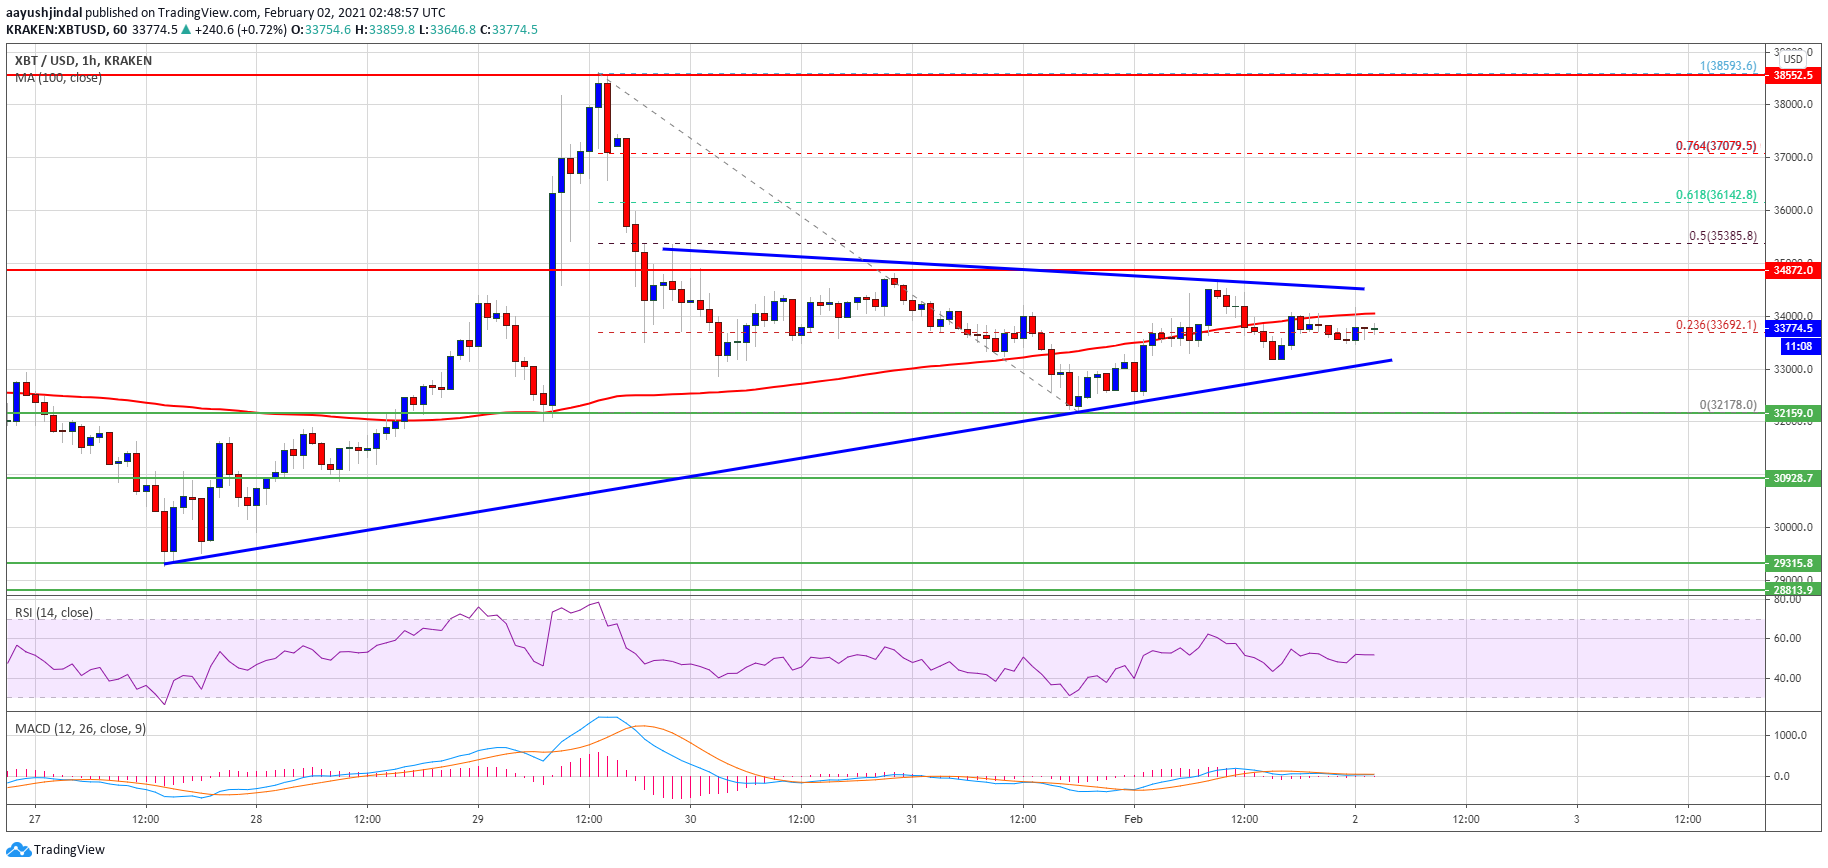
Source: BTCUSD on TradingView.com
If there is a clear break above the triangle resistance and $34,850, the price could clear the $35,000 barrier. The next key resistance is near the $35,380 level. It is close to the 50% downward move from the $38,590 swing high to $32,178 low.
A successful break above the $35,000 resistance level with a follow up move above $35,380 could open the doors for a larger increase in the coming sessions. The next major resistance for bitcoin sits at $36,150.
Fresh Downside Break in BTC?
If bitcoin fails to clear the $34,500 resistance zone, there is a risk of a fresh bearish wave. An initial support is near the $33,000 level and the triangle lower trend line.
A downside break below the triangle support trend line could push the price towards the $32,150 and $32,000 support levels. Any more losses could lead the price towards the $31,000 support zone.
Technical indicators:
Hourly MACD – The MACD is slowly losing pace in the bullish zone.
Hourly RSI (Relative Strength Index) – The RSI for BTC/USD is now close to the 50 level.
Major Support Levels – $33,000, followed by $32,150.
Major Resistance Levels – $34,500, $35,000 and $35,380.


