
Reason to trust
How Our News is Made
Strict editorial policy that focuses on accuracy, relevance, and impartiality
Ad discliamer
Morbi pretium leo et nisl aliquam mollis. Quisque arcu lorem, ultricies quis pellentesque nec, ullamcorper eu odio.
Bitcoin price is consolidating in a range below the $11,500 resistance against the US Dollar. BTC could start a substantial decline if it breaks the $11,230 support zone.
- Bitcoin is struggling to gain traction above the $11,500 and $11,520 resistance levels.
- The price is currently trading below $10,400 support and the 100 hourly simple moving average.
- There is a short-term contracting triangle forming with resistance near $11,480 on the hourly chart of the BTC/USD pair (data feed from Kraken).
- The pair could start a strong downside correction if it breaks the $11,230 and $11,200 support levels.
Bitcoin Price Consolidating Gains
In the past three sessions, there were mostly range moves in bitcoin price below the $11,560 and $11,500 resistance levels. It seems like BTC made two attempts to surpass the $11,560 level, but it failed to gain bullish momentum.
The last swing high was near $11,560 before the price declined below $11,400. It traded as low as $11,302 and it is currently correcting higher. There was a break above the $11,350 level, plus the 23.6% Fib retracement level of the recent decline from the $11,560 high to $11,302 low.
However, bitcoin is still trading below $10,400 support and the 100 hourly simple moving average. An immediate resistance is near the $11,430 level since it is close to the 50% Fib retracement level of the recent decline from the $11,560 high to $11,302 low.
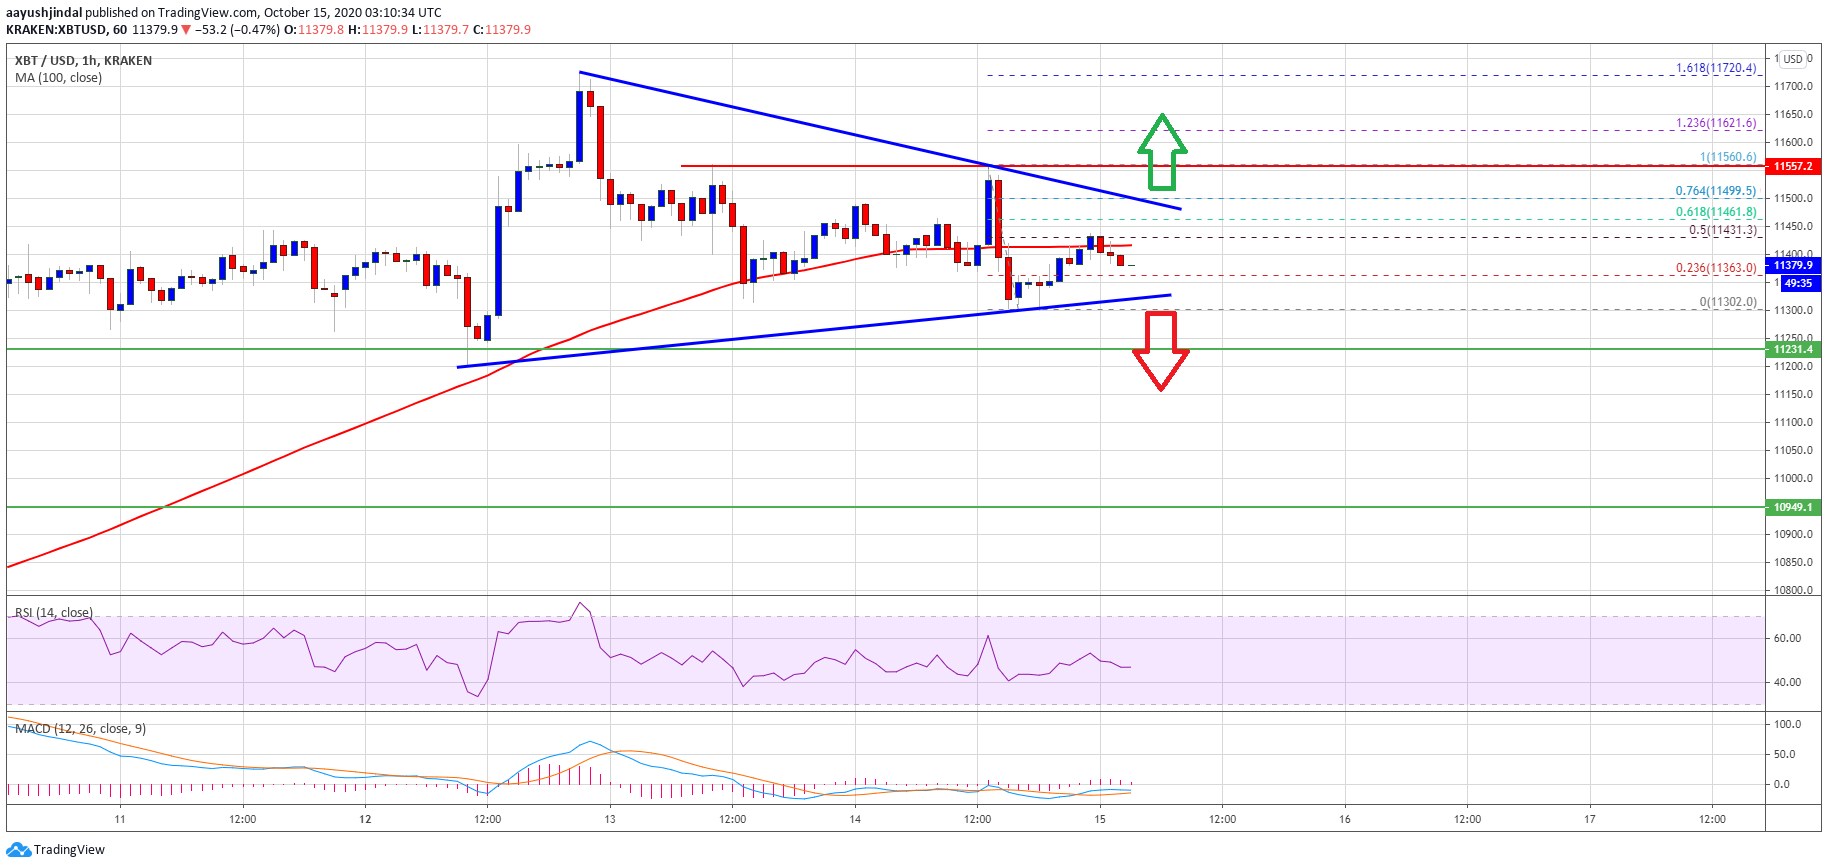
Source: BTCUSD on TradingView.com
There is also a short-term contracting triangle forming with resistance near $11,480 on the hourly chart of the BTC/USD pair. To start a strong increase, bitcoin price needs to gain momentum above the $11,500 and $11,560 resistance levels. The next stop could be near $11,700, above which there are chances of a push towards the $12,000 level.
Downside Break in BTC?
If bitcoin fails to surpass the $11,500 and $11,560 resistance levels, there is a risk of a bearish break. The triangle support is near the $11,320 level.
The main support is near the $11,230 and $11,200 levels, below which the bears are likely to aim a larger downside correction. The next immediate support could be $11,000, below which the price might slide towards $10,500.
Technical indicators:
Hourly MACD – The MACD is about to move into the bearish zone.
Hourly RSI (Relative Strength Index) – The RSI for BTC/USD is just below the 50 level, with a flat bias.
Major Support Levels – $11,320, followed by $11,230.
Major Resistance Levels – $11,480, $11,500 and $11,560.


