
Reason to trust
How Our News is Made
Strict editorial policy that focuses on accuracy, relevance, and impartiality
Ad discliamer
Morbi pretium leo et nisl aliquam mollis. Quisque arcu lorem, ultricies quis pellentesque nec, ullamcorper eu odio.
Bitcoin price recovered above $33,000, but it failed to climb above $35,000 against the US Dollar. BTC is retreating from the 100 hourly SMA and it could extend its losses.
- Bitcoin started a decent recovery and it climbed above the $34,000 level.
- The price is now facing hurdles near $34,000 and the 100 hourly simple moving average.
- There is a crucial bearish trend line forming with resistance near $33,800 on the hourly chart of the BTC/USD pair (data feed from Kraken).
- The pair must clear the 100 hourly SMA and $34,000 to continue higher in the near term.
Bitcoin Price is Facing Hurdles
Bitcoin started a steady increase above the $33,000 and $33,500 resistance levels. BTC even spiked above the $34,000 resistance zone, but it failed to gain pace above the 100 hourly simple moving average.
It is now facing hurdles near $34,000 and the 100 hourly simple moving average. A high was formed near $34,877 and the price is now correcting gains. It declined below the 23.6% Fib retracement level of the recent recovery from the $28,900 swing low to $34,877 high.
An immediate support on the downside is near the $31,800 level. It is near the 50% Fib retracement level of the recent recovery from the $28,900 swing low to $34,877 high.
On the upside, an initial resistance is near the $33,800 level. There is also a crucial bearish trend line forming with resistance near $33,800 on the hourly chart of the BTC/USD pair. The main resistance is still near the $34,000 zone.
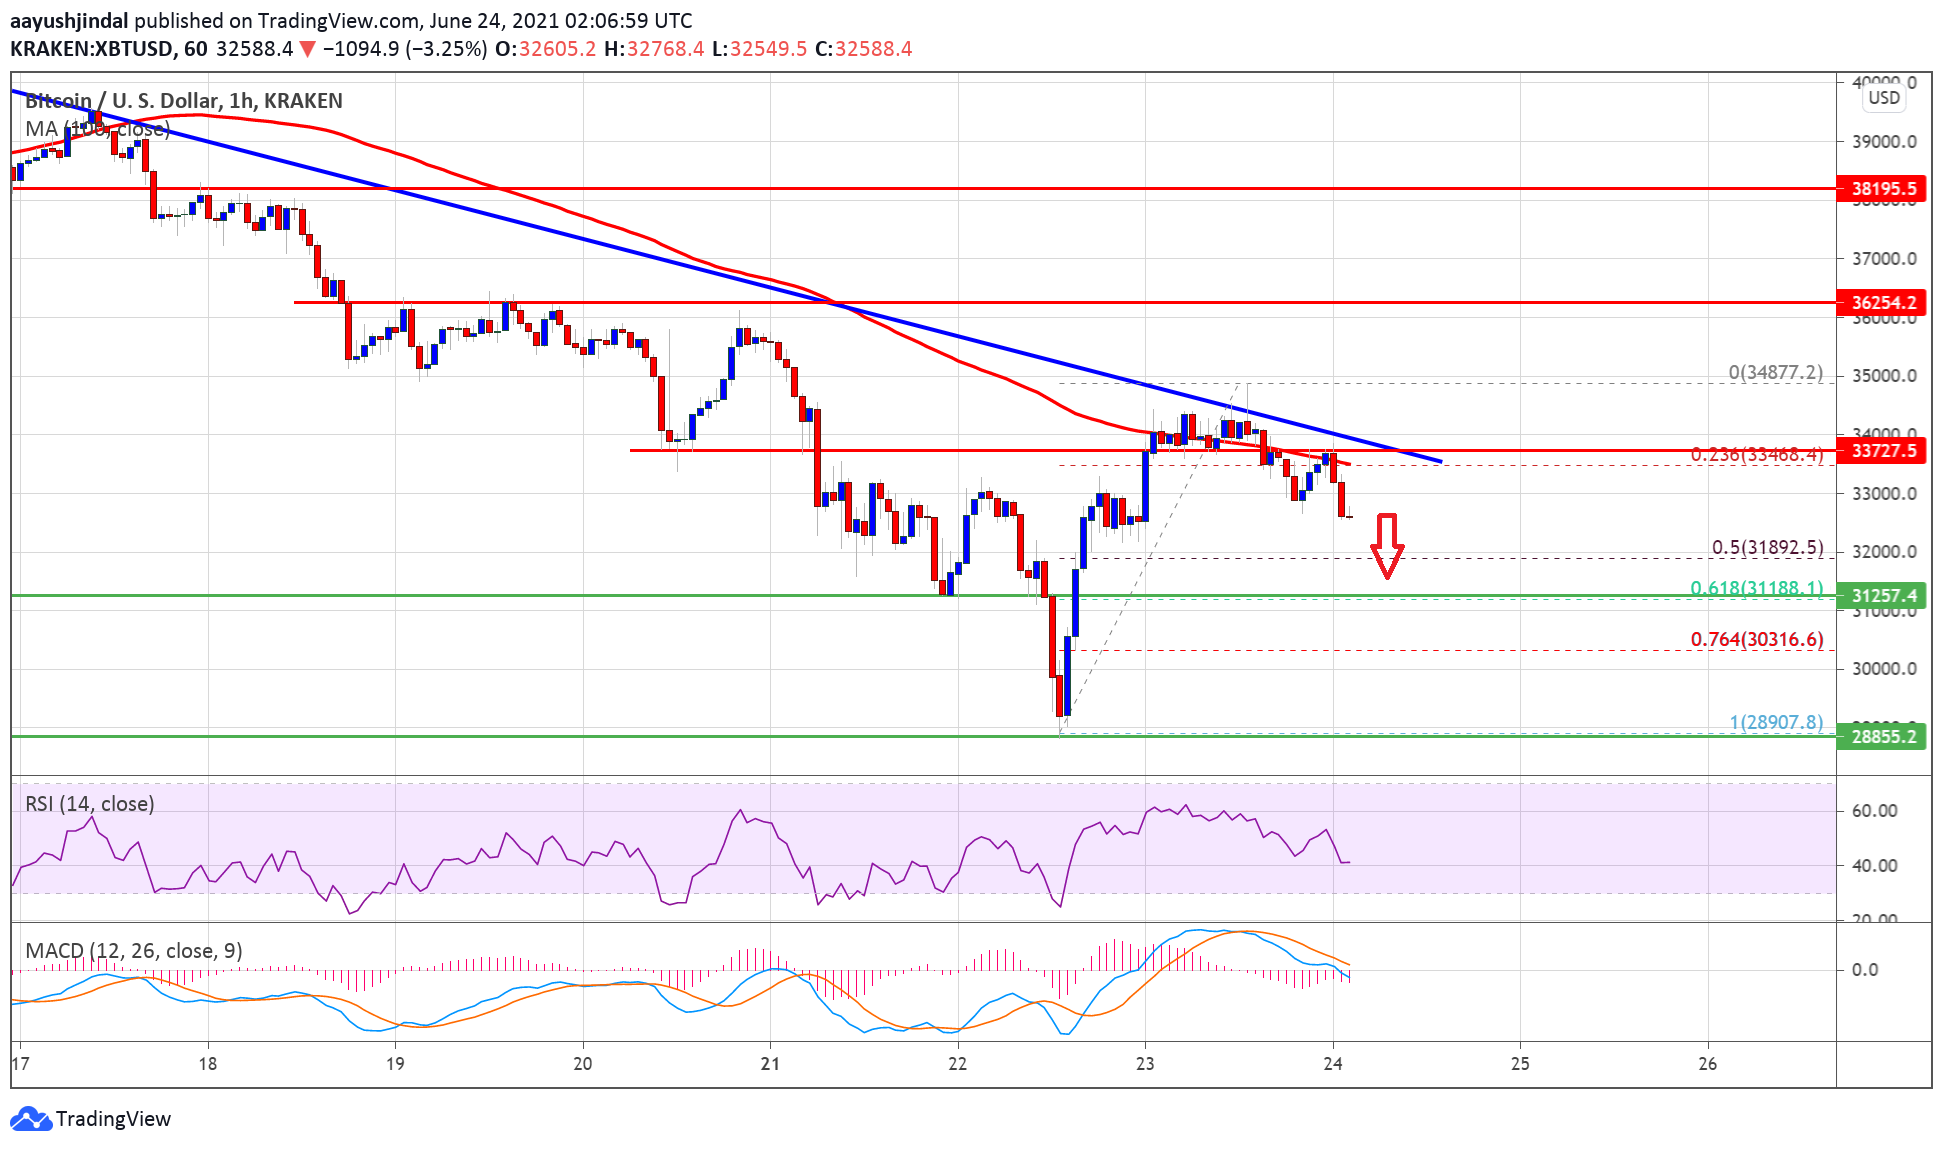
Source: BTCUSD on TradingView.com
Bitcoin must clear the 100 hourly SMA and then settle above the $34,000 zone to move into a positive zone. The next major resistance for the bulls could be $35,000.
More Losses in BTC?
If bitcoin fails to clear the $34,000 resistance or the trend line resistance, it could continue to move down. An immediate support on the downside is near the $31,800 level.
The next major support is near the $31,200 level. A downside break below $31,200 could open the doors for a fresh drop towards the $30,000 zone in the coming sessions.
Technical indicators:
Hourly MACD – The MACD is now moving into the bearish zone.
Hourly RSI (Relative Strength Index) – The RSI for BTC/USD is back below the 50 level.
Major Support Levels – $31,800, followed by $31,200.
Major Resistance Levels – $33,800, $34,000 and $35,000.


