
Reason to trust
How Our News is Made
Strict editorial policy that focuses on accuracy, relevance, and impartiality
Ad discliamer
Morbi pretium leo et nisl aliquam mollis. Quisque arcu lorem, ultricies quis pellentesque nec, ullamcorper eu odio.
Bitcoin price is holding the $55,000 support zone against the US Dollar. BTC must clear the $57,000 resistance and the 100 hourly SMA to move into a positive zone.
- Bitcoin is somehow holding the $55,000 and $54,500 support levels.
- The price is now facing a strong resistance near $57,500 and the 100 hourly simple moving average.
- There was a break above a major declining channel with resistance near $55,250 on the hourly chart of the BTC/USD pair (data feed from Kraken).
- The pair could start a strong increase if there is a clear break above the $57,500 resistance zone.
Bitcoin Price is Facing Hurdles
Bitcoin remained below the main $57,500 resistance zone. BTC declined below the $55,000 support, but it found support near the $53,400 zone. A low was formed near $53,338 before the price started a fresh increase.
It broke the $54,500 and $55,000 resistance levels. There was also a break above a major declining channel with resistance near $55,250 on the hourly chart of the BTC/USD pair. The pair even climbed above $57,000, but it failed to clear the 100 hourly simple moving average.
A high is formed near $57,150 and the price is now correcting lower. It traded close to the 50% Fib retracement level of the upward move from the $53,338 low to $57,151 high.
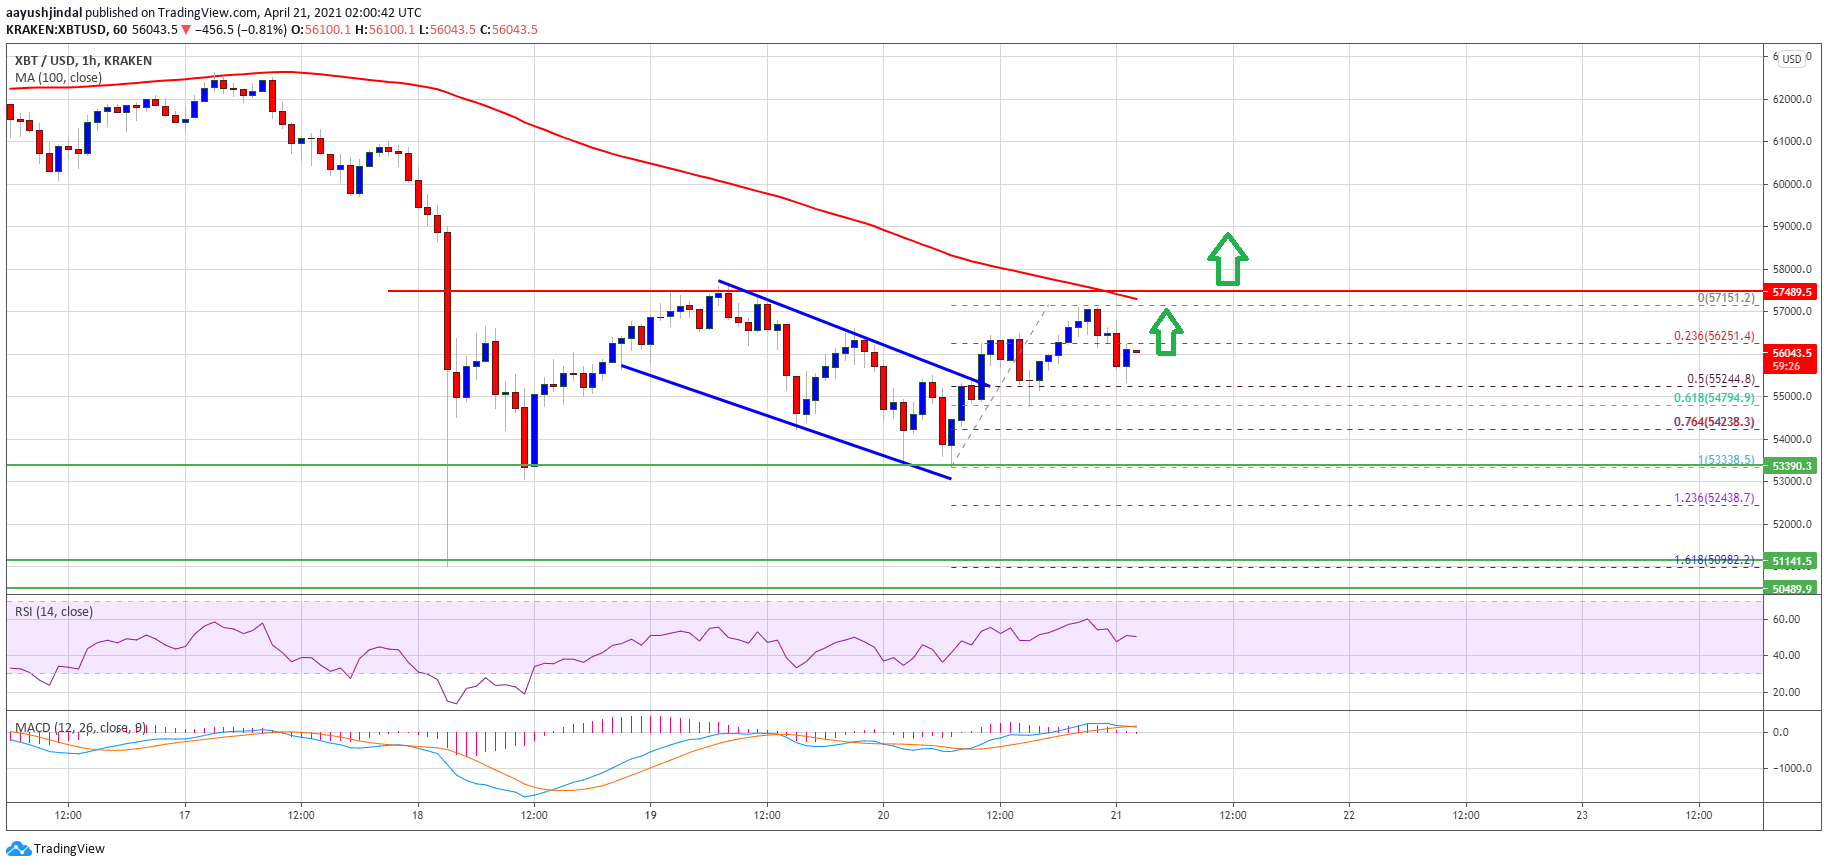
Source: BTCUSD on TradingView.com
On the upside, the price is facing a strong resistance near the $57,100 and $57,500 levels. The 100 hourly simple moving average is also near the $57,500 level to act as a hurdle. A successful break above the $57,500 resistance is must to start a strong increase in the coming sessions.
Dips Supported in BTC?
If bitcoin fails to clear the $57,000 and $57,500 resistance levels, it could correct lower. An immediate support on the downside is near the $55,200 level.
The first key support is near the $54,800 level. It is near the 61.8% Fib retracement level of the upward move from the $53,338 low to $57,151 high. Any more losses may possibly call for a retest of the $53,350 zone in the near term.
Technical indicators:
Hourly MACD – The MACD is struggling to gain momentum in the bullish zone.
Hourly RSI (Relative Strength Index) – The RSI for BTC/USD is now close to the 50 level.
Major Support Levels – $55,200, followed by $54,800.
Major Resistance Levels – $56,500, $57,100 and $57,500.


