
Reason to trust
How Our News is Made
Strict editorial policy that focuses on accuracy, relevance, and impartiality
Ad discliamer
Morbi pretium leo et nisl aliquam mollis. Quisque arcu lorem, ultricies quis pellentesque nec, ullamcorper eu odio.
Bitcoin price is up over 2% and it broke the $11,800 and $12,000 resistance levels against the US Dollar. BTC is now trading above $12,000, with high chances of more upsides.
- Bitcoin remained in a positive zone and it cleared the $11,800 and $12,000 resistance levels.
- The price is currently testing the $12,150 zone and it is well above the 100 hourly simple moving average.
- There is a major bullish trend line forming with support near $11,980 on the hourly chart of the BTC/USD pair (data feed from Kraken).
- The pair is likely to accelerate higher above $12,100 and $12,200 in the near term.
Bitcoin Price is Gaining Momentum
Bitcoin price gained bullish momentum after a successful close above the $11,560 resistance. BTC even broke the $11,800 resistance and settled well above the 100 hourly simple moving average.
As a result, the bulls gained strength and they were able to push the price above the $12,000 resistance. A new weekly high is formed near $12,160 and the price is currently showing a lot of positive signs.
An initial support for bitcoin is near the $12,050 level. It is close to the 23.6% Fib retracement level of the recent rise from the $11,870 low to $12,158 high. There is also a major bullish trend line forming with support near $11,980 on the hourly chart of the BTC/USD pair.
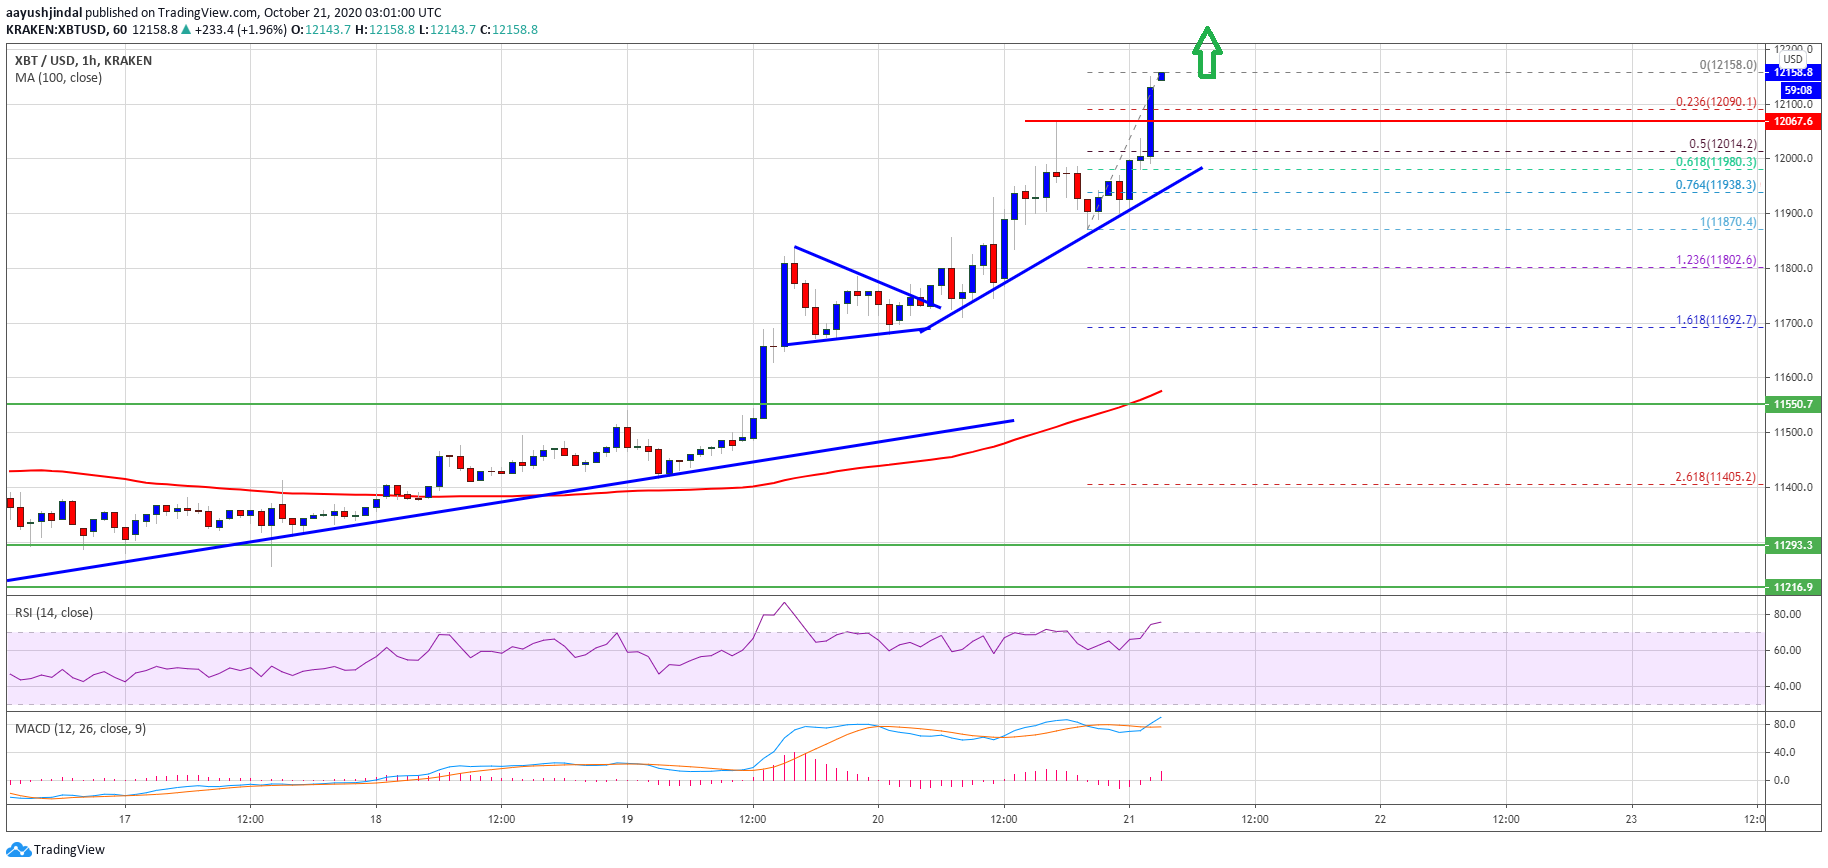
Source: BTCUSD on TradingView.com
The trend line is close to the 50% Fib retracement level of the recent rise from the $11,870 low to $12,072 high. On the upside, the $12,075 and $12,100 levels are initial barriers for the bulls.
The first major resistance is near the $12,200 level. A successful close above the $12,200 level could open the doors for a decent increase towards the $12,500 resistance level.
Downside Correction in BTC?
If bitcoin starts a downside correction, it is likely to find bids near the $12,050 and $12,000 levels. If there is a downside break below the trend line support and a close below $12,000, there could be an extended downside correction.
The next major support is near the $11,880 level, followed by the key $11,800 support level (the recent breakout zone).
Technical indicators:
Hourly MACD – The MACD is now gaining pace in the bullish zone.
Hourly RSI (Relative Strength Index) – The RSI for BTC/USD is well above the 65 level, with a positive angle.
Major Support Levels – $12,050, followed by $12,000.
Major Resistance Levels – $12,150, $11,200 and $12,500.


