
Reason to trust
How Our News is Made
Strict editorial policy that focuses on accuracy, relevance, and impartiality
Ad discliamer
Morbi pretium leo et nisl aliquam mollis. Quisque arcu lorem, ultricies quis pellentesque nec, ullamcorper eu odio.
Bitcoin price is showing bearish signs below $18,050 against the US Dollar. BTC is now likely to continue lower and it could even trade below $17,500
- Bitcoin is showing a few bearish signs below the $18,200 and $18,500 resistance levels.
- The price is now trading well below the $18,500 level and the 100 hourly simple moving average.
- There is a major bearish trend line forming with resistance near $18,380 on the hourly chart of the BTC/USD pair (data feed from Kraken).
- The pair is likely to break the $17,644 swing low and continue lower in the near term.
Bitcoin Price is Showing Bearish Signs
After struggling to clear the $18,600 resistance, bitcoin price started a steady decline. A high was formed near $18,640 before BTC price traded below the $18,400 level.
The bulls seem to have lost control since the price is now trading well below the $18,500 level and the 100 hourly simple moving average. There was a break below the 50% Fib retracement level of the upward move from the $17,644 low to $18,640 swing high.
The price is trading below the $18,000 level and signaling more losses. It is also below the 76.4% Fib retracement level of the upward move from the $17,644 low to $18,640 swing high.
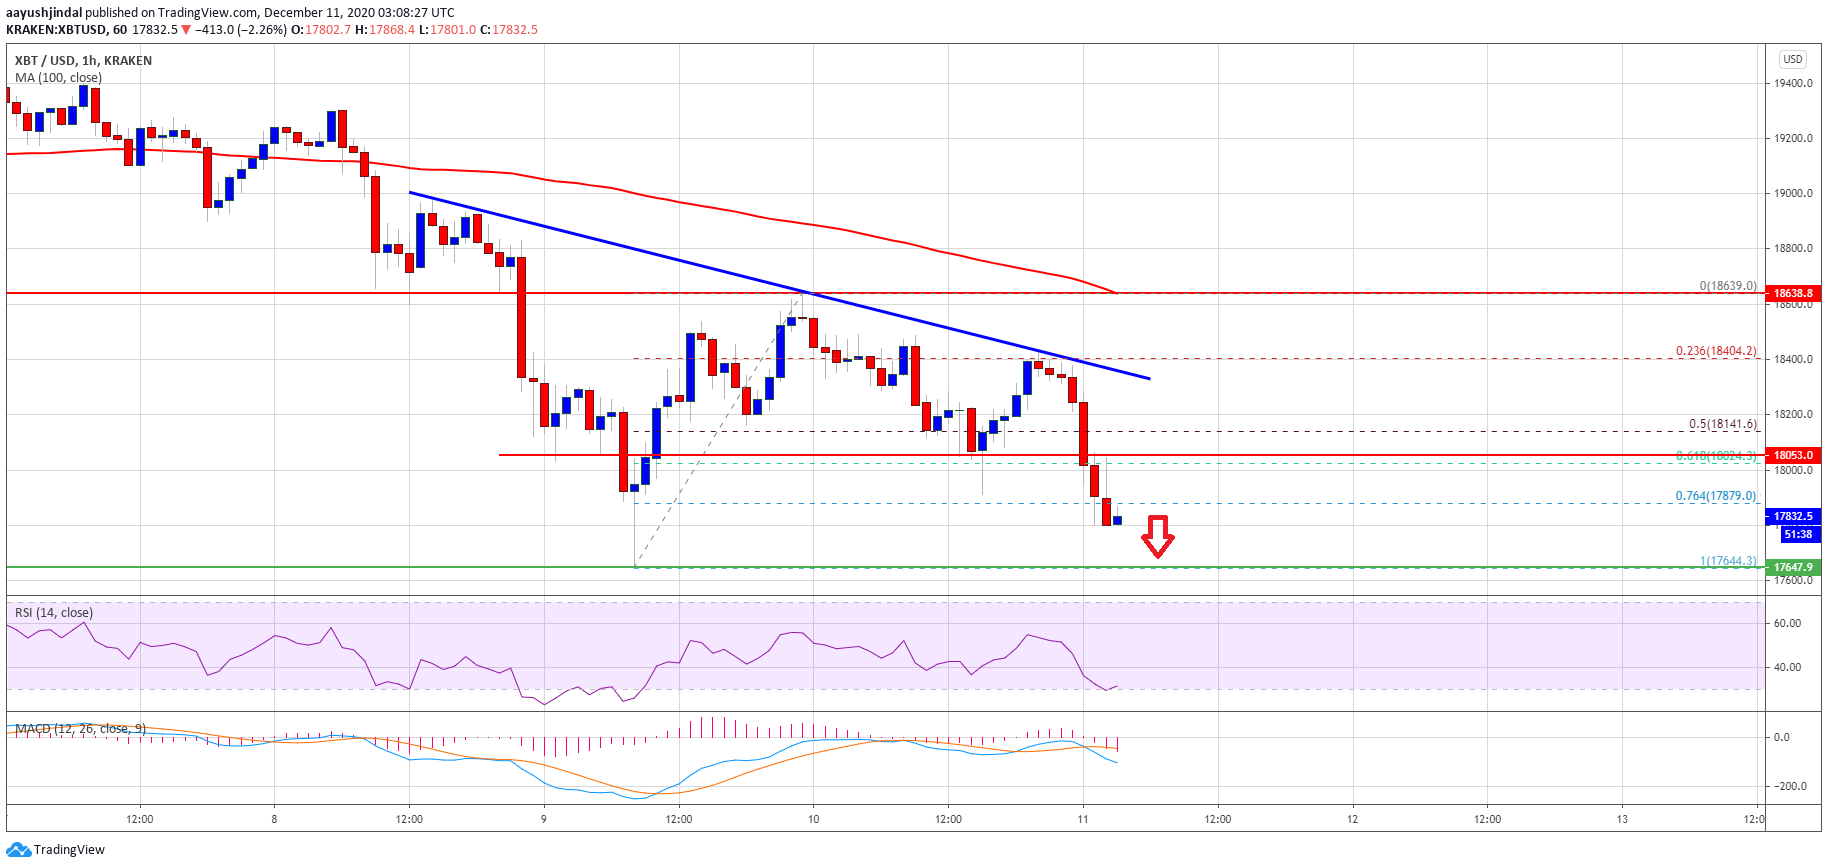
Source: BTCUSD on TradingView.com
There is also a major bearish trend line forming with resistance near $18,380 on the hourly chart of the BTC/USD pair. On the downside, the $17,644 swing low is a short-term support zone. If there is a downside break below the recent low, there is a risk of a sharp decline below the $17,500 level. The next key support is near the $17,200 level.
Upsides Capped in BTC?
If bitcoin starts a short-term upward move, it might struggle to clear the $18,000 resistance level. The first major resistance is near the $18,200 level.
The main resistance is now forming near the trend line and $18,400. A clear break above $18,400 and $18,500 could be very tough in the coming sessions.
Technical indicators:
Hourly MACD – The MACD is slowly gaining pace in the bearish zone.
Hourly RSI (Relative Strength Index) – The RSI for BTC/USD is currently well below the 50 level.
Major Support Levels – $17,650, followed by $17,200.
Major Resistance Levels – $18,000, $18,200 and $18,400.


