
Reason to trust
How Our News is Made
Strict editorial policy that focuses on accuracy, relevance, and impartiality
Ad discliamer
Morbi pretium leo et nisl aliquam mollis. Quisque arcu lorem, ultricies quis pellentesque nec, ullamcorper eu odio.
Bitcoin price extended its rally above the $51,000 level and it even broke $52,000 against the US Dollar. BTC traded to a new all-time high near $52,745 and it is consolidating gains.
- Bitcoin broke the $52,000 resistance and traded to a new all-time high near $52,745.
- The price is trading nicely near $52,000 and it is well above the 100 hourly simple moving average.
- There is a short-term contracting triangle with resistance near $52,250 on the hourly chart of the BTC/USD pair (data feed from Kraken).
- The pair could dip towards $51,500 or $51,000, but the bulls are likely to remain active.
Bitcoin Price is Showing Positive Signs
There were mostly bullish moves in bitcoin price above the $50,000 resistance. BTC extended its rally above the $51,000 and $51,500 resistance levels.
During the increase, there was a break above a key contracting triangle with resistance near $51,200 on the hourly chart of the BTC/USD pair. It opened the doors for more gains above $52,000 (as discussed yesterday).
The price traded to a new all-time high near $52,745 before starting a downside correction. It is trading near $52,000 and it is well above the 100 hourly simple moving average. There was a break below the 23.6% Fib retracement level of the recent increase from the $50,773 swing low to $52,744 high.
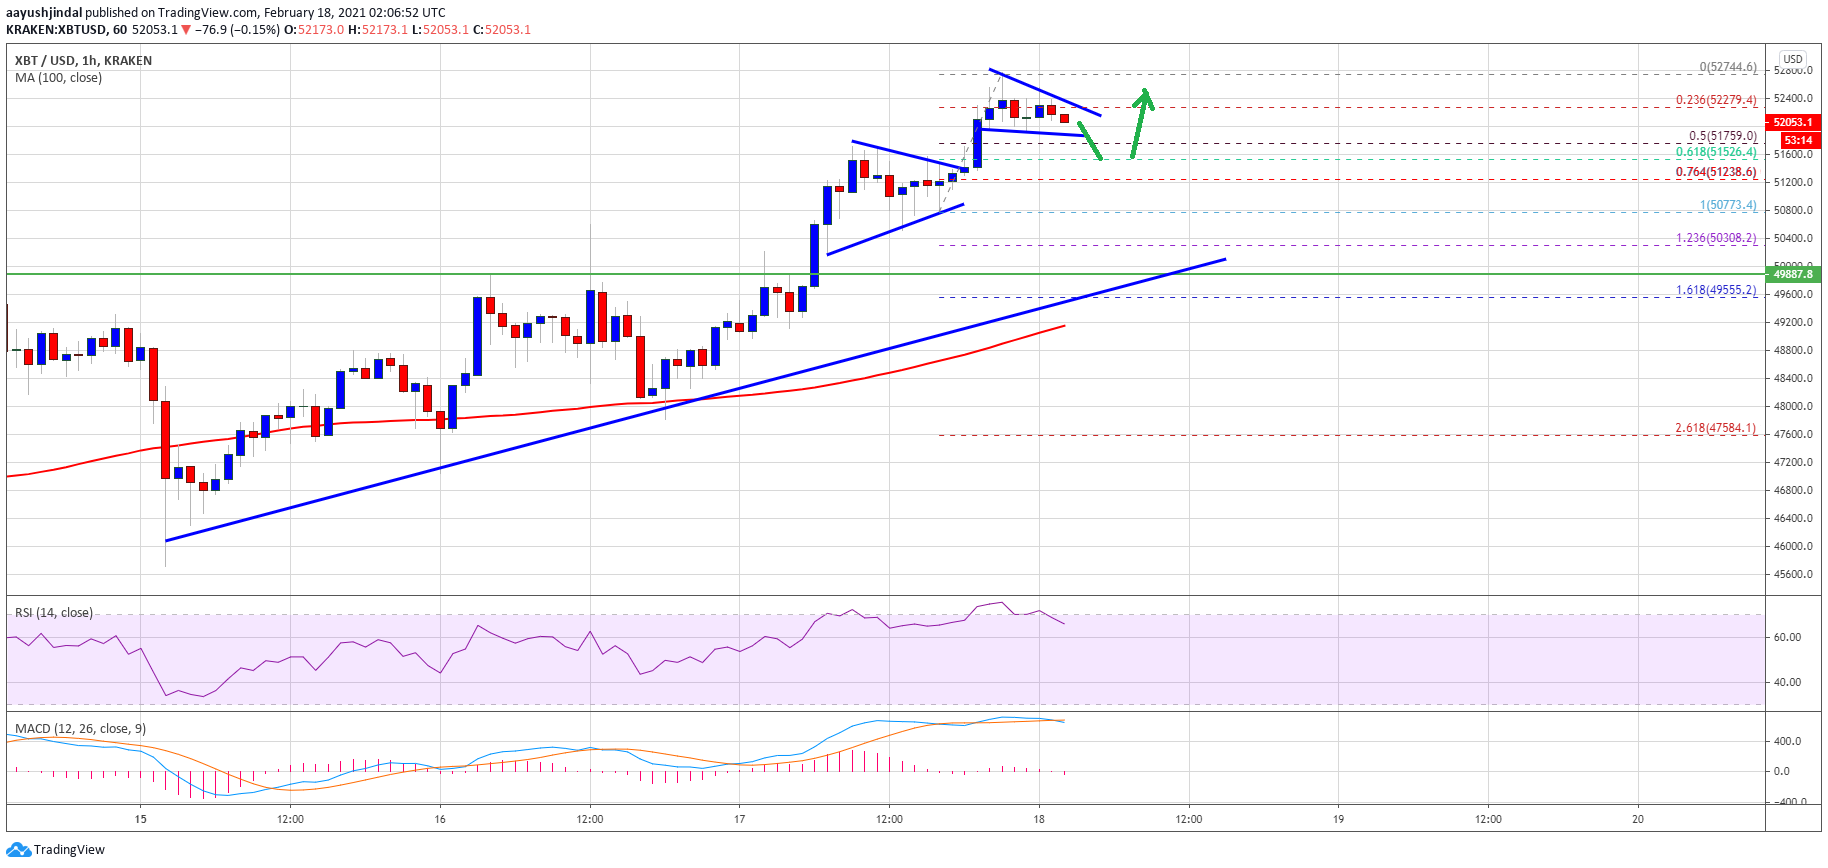
Source: BTCUSD on TradingView.com
There is also another short-term contracting triangle with resistance near $52,250 on the same chart. If bitcoin price remains stable, there are chances of a fresh increase above the $52,250 and $52,500 levels.
The next major resistance is near the $52,744 high, above which the bulls could aim a break above the $53,000 and $53,200 levels in the near term.
Dips Supported BTC?
If bitcoin fails to clear the triangle resistance, it could correct lower below $52,000. The next support is near the $51,750 level. It is close to the 50% Fib retracement level of the recent increase from the $50,773 swing low to $52,744 high.
The main support is now forming near the $51,500 level, where the bulls are likely to take a stand. Any more losses might lead the price towards the $50,500 support level.
Technical indicators:
Hourly MACD – The MACD is losing momentum in the bullish zone.
Hourly RSI (Relative Strength Index) – The RSI for BTC/USD is now well above the 60 level.
Major Support Levels – $51,500, followed by $50,500.
Major Resistance Levels – $52,250, $52,750 and $53,000.


