
Reason to trust
How Our News is Made
Strict editorial policy that focuses on accuracy, relevance, and impartiality
Ad discliamer
Morbi pretium leo et nisl aliquam mollis. Quisque arcu lorem, ultricies quis pellentesque nec, ullamcorper eu odio.
Bitcoin price started a fresh increase above the $32,500 and $33,500 resistance levels against the US Dollar. BTC is showing positive signs, but $34,500 and $35,000 still presents a major resistance.
- Bitcoin is up over 10% and it broke the $34,000 resistance level.
- The price is currently trading well above the $33,200 pivot level and the 100 hourly simple moving average.
- There is a major bullish trend line forming with support near $33,200 on the hourly chart of the BTC/USD pair (data feed from Kraken).
- The pair could correct lower, but it is likely to find bids near $33,200 or $32,800.
Bitcoin Price Gains Over 10%
After forming a support base above $32,000, bitcoin price started a strong increase. BTC broke the $32,500 and $33,200 resistance levels to move into a short-term positive zone.
During the increase, there was break above a key bearish trend line with resistance near $31,550 on the hourly chart of the BTC/USD pair. The increase was such that the pair even cleared the $34,000 resistance and settled above the 100 hourly simple moving average.
A high was formed near $34,424 and the price is currently consolidating gains. An initial support is near the $33,200 level. It is close to the 23.6% Fib retracement level of the upward move from the $29,282 swing low to $34,424 high.
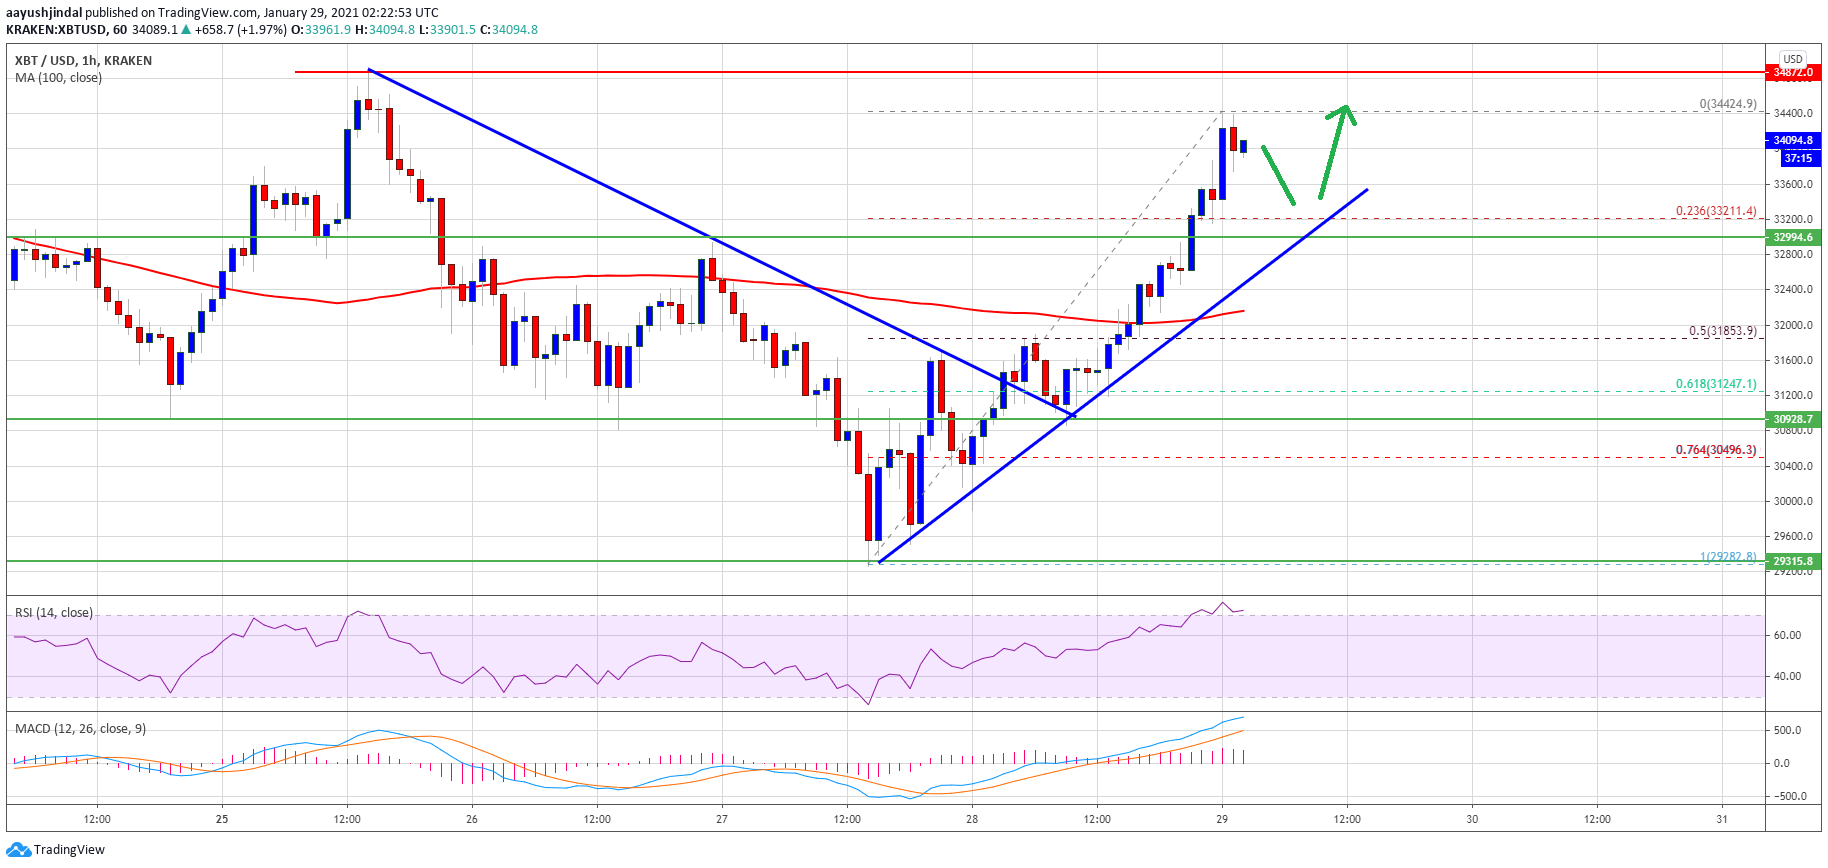
Source: BTCUSD on TradingView.com
There is also a major bullish trend line forming with support near $33,200 on the same chart. On the upside, the price is facing a lot of strong hurdles near $34,500 and $35,000.
To move into a positive zone for a larger rally, bitcoin must break the $34,500 resistance and then settle above the key $35,000 barrier in the near term.
Fresh Dip in BTC?
If bitcoin fails to clear the $34,500 resistance or $35,000, it could start a fresh decline. An initial support is near the trend line at $33,200.
The main support is now forming near the $32,000 zone. It is close to the 100 hourly simple moving average, and the 50% Fib retracement level of the upward move from the $29,282 swing low to $34,424 high. Any more losses may possibly call for a test of $31,200.
Technical indicators:
Hourly MACD – The MACD is slowly losing pace in the bullish zone.
Hourly RSI (Relative Strength Index) – The RSI for BTC/USD is now well above the 60 level.
Major Support Levels – $33,200, followed by $32,000.
Major Resistance Levels – $34,500, $34,800 and $35,000.


