
Reason to trust
How Our News is Made
Strict editorial policy that focuses on accuracy, relevance, and impartiality
Ad discliamer
Morbi pretium leo et nisl aliquam mollis. Quisque arcu lorem, ultricies quis pellentesque nec, ullamcorper eu odio.
Bitcoin price is slowly moving lower below the $28,500 level. BTC could drop toward the $28,000 level or the 100 hourly SMA before the bulls take a stand.
- Bitcoin is struggling to gain traction for a move above the $28,500 level.
- The price is trading above $27,750 and the 100 hourly Simple moving average.
- There was a break below a key bullish trend line with support near $28,400 on the hourly chart of the BTC/USD pair (data feed from Kraken).
- The pair could revisit the 100 hourly Simple moving average before it attempts a fresh increase.
Bitcoin Price Extends Downside Correction
Bitcoin price started a downside correction from the $30,000 resistance zone. BTC struggled to stay in a positive zone and settled below the $28,500 pivot level.
Recently, the bears pushed the price below the $28,200 level. Besides, there was a break below a key bullish trend line with support near $28,400 on the hourly chart of the BTC/USD pair. A low is formed near $28,150 and the price is now consolidating losses.
Bitcoin is now trading above $27,750 and the 100 hourly Simple moving average. On the upside, immediate resistance is near the $28,550 level. It is close to the 50% Fib retracement level of the recent decline from the $28,980 swing high to the $28,150 low.
The next key resistance could be near $28,800 or the 76.4% Fib retracement level of the recent decline from the $28,980 swing high to the $28,150 low.
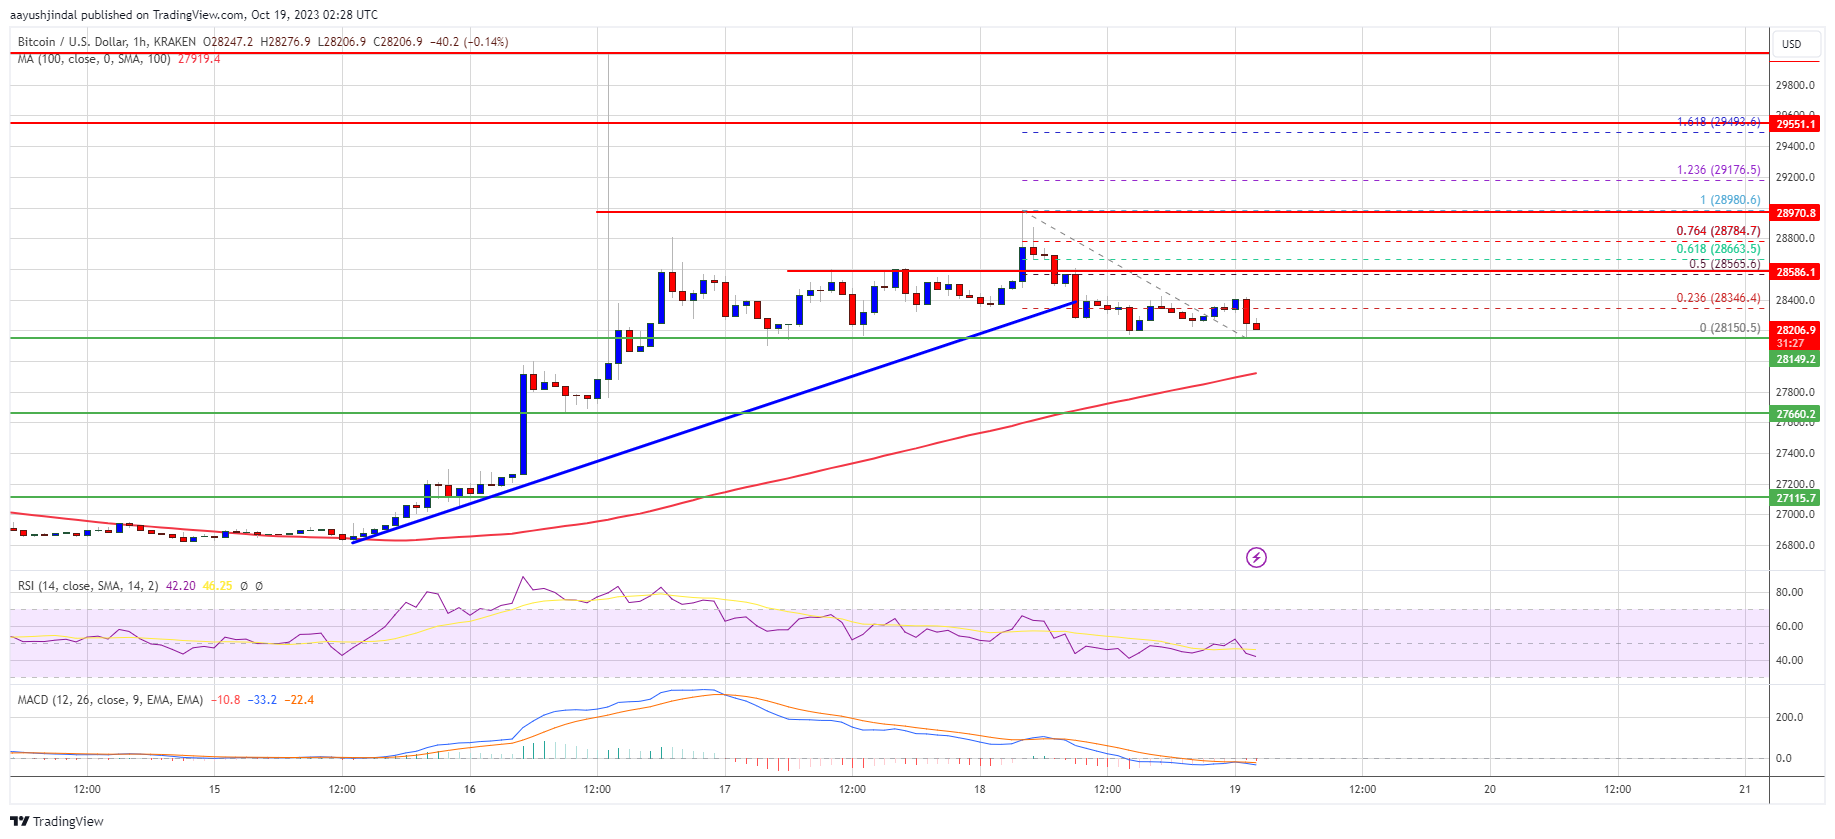
Source: BTCUSD on TradingView.com
The main resistance is now near the $29,000 zone. A clear move above the $29,000 resistance zone could set the pace for a larger increase. The next key resistance could be $29,500. Any more gains might send BTC toward the $30,000 level.
More Losses In BTC?
If Bitcoin fails to rise above the $28,550 resistance zone, it could slide further. Immediate support on the downside is near the $28,150 level.
The next major support is near the $28,000 level and the 100 hourly Simple moving average. A downside break and close below the $28,000 support might trigger more losses in the near term. The next support sits at $27,660, below which it could test $28,120.
Technical indicators:
Hourly MACD – The MACD is now gaining pace in the bearish zone.
Hourly RSI (Relative Strength Index) – The RSI for BTC/USD is now below the 50 level.
Major Support Levels – $28,150, followed by $28,000.
Major Resistance Levels – $28,550, $28,800, and $29,000.


