
Reason to trust
How Our News is Made
Strict editorial policy that focuses on accuracy, relevance, and impartiality
Ad discliamer
Morbi pretium leo et nisl aliquam mollis. Quisque arcu lorem, ultricies quis pellentesque nec, ullamcorper eu odio.
Bitcoin gained bullish momentum and rallied above the $11,000 resistance against the US Dollar. BTC is consolidating gains above $11,200 and it could extend its rise to $12,000.
- Bitcoin started a strong increase after it cleared the $10,950 and $11,000 resistance levels.
- The price is now trading well above $11,200 and the 100 simple moving average (4-hours).
- There was a break above a major contracting triangle with resistance near $10,750 on the 4-hours chart of the BTC/USD pair (data feed from Kraken).
- The pair could correct lower, but buyers are likely to remain active near $11,200 and $11,000.
Bitcoin Turns Green
This past week, bitcoin made a few attempts to clear the $10,800 and $11,000 resistance levels against the US Dollar. Finally, the bulls gained strength and the price climbed sharply above $11,000.
The recent rally was initiated after there was a break above a major contracting triangle with resistance near $10,750 on the 4-hours chart of the BTC/USD pair. The upward move was such that the price even broke the $11,200 resistance.
It tested the $11,500 zone and a new monthly high is formed at $11,500. The price is now trading well above $11,200 and the 100 simple moving average (4-hours).
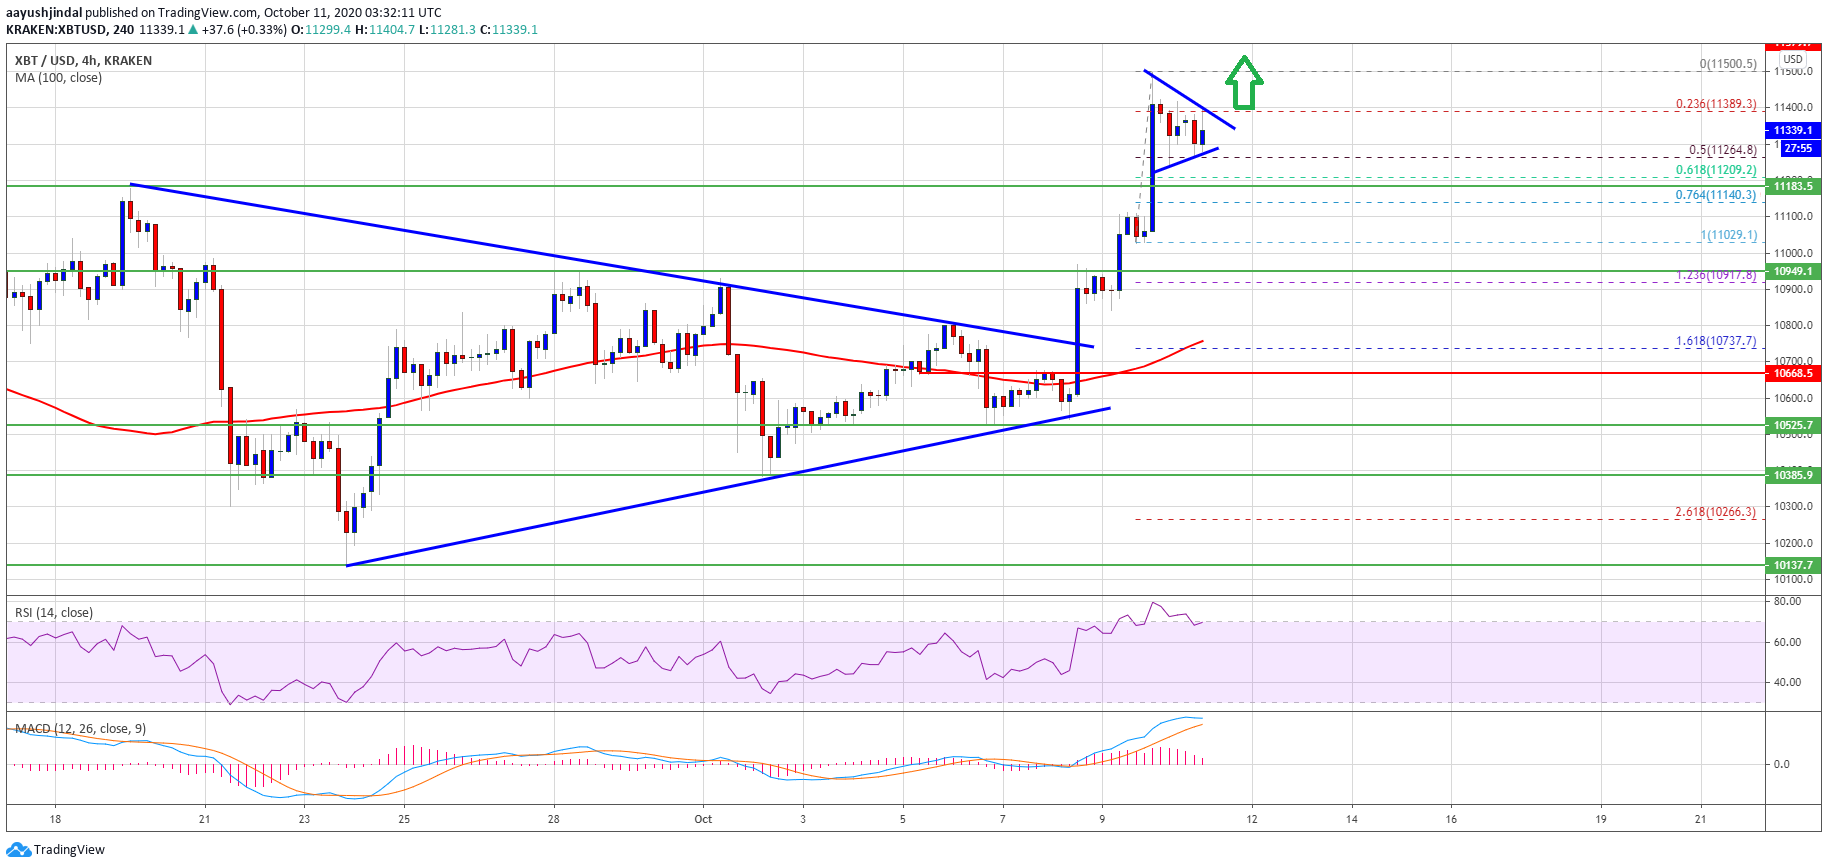
Bitcoin price rallies above $11,200. Source: TradingView.com
It seems like there is a short-term bullish continuation pattern forming with resistance near $11,400. On the downside, the triangle support is near $11,250 and the 50% Fib retracement level of the recent rally from the $11,029 swing low to $11,500 high.
If there is an upside break above the $11,400 level, the price is likely to clear the $11,500 high as well. The next major hurdle for the bulls is near the $11,800 level. Any further gains could lead bitcoin towards the $12,000 resistance level.
Downsides Could Be Limited in BTC
If bitcoin starts a downside correction, the triangle support at $11,250 might provide support. The next major support is near the $11,200 level or the 61.8% Fib retracement level of the recent rally from the $11,029 swing low to $11,500 high.
A downside break below the $11,250 and $11,200 support levels could start a steady decline towards the $11,000 support (key resistance turned support).
Technical indicators
4 hours MACD – The MACD for BTC/USD is showing positive signs in the bullish zone.
4 hours RSI (Relative Strength Index) – The RSI for BTC/USD is now above the 60 level.
Major Support Level – $11,200
Major Resistance Level – $11,400


