
Reason to trust
How Our News is Made
Strict editorial policy that focuses on accuracy, relevance, and impartiality
Ad discliamer
Morbi pretium leo et nisl aliquam mollis. Quisque arcu lorem, ultricies quis pellentesque nec, ullamcorper eu odio.
[vc_row][vc_column][vc_column_text]Bitcoin price remained strong above the $16,700 level. BTC formed a base and started a fresh increase above the $17,000 resistance zone.
- Bitcoin found support near $16,700 and started a decent increase.
- The price is trading above $17,000 and the 100 hourly simple moving average.
- There was a break above a major bearish trend line with resistance near $16,875 on the hourly chart of the BTC/USD pair (data feed from Kraken).
- The pair is eyeing more gains above the $17,400 and $17,500 resistance levels.
Bitcoin Price Eyes Upside Break
Bitcoin price declined below the $16,800 support level. However, BTC bears failed to clear the $16,700 level. The price traded as low as $16,700 before there was a fresh increase.
There was a decent increase above the $16,850 and $16,900 levels. The price cleared the 50% Fib retracement level of the downward move from the $17,440 swing high to $16,700 low. Besides, there was a break above a major bearish trend line with resistance near $16,875 on the hourly chart of the BTC/USD pair.
Bitcoin price is now trading above $17,000 and the 100 hourly simple moving average. It is also trading near the 76.4% Fib retracement level of the downward move from the $17,440 swing high to $16,700 low.
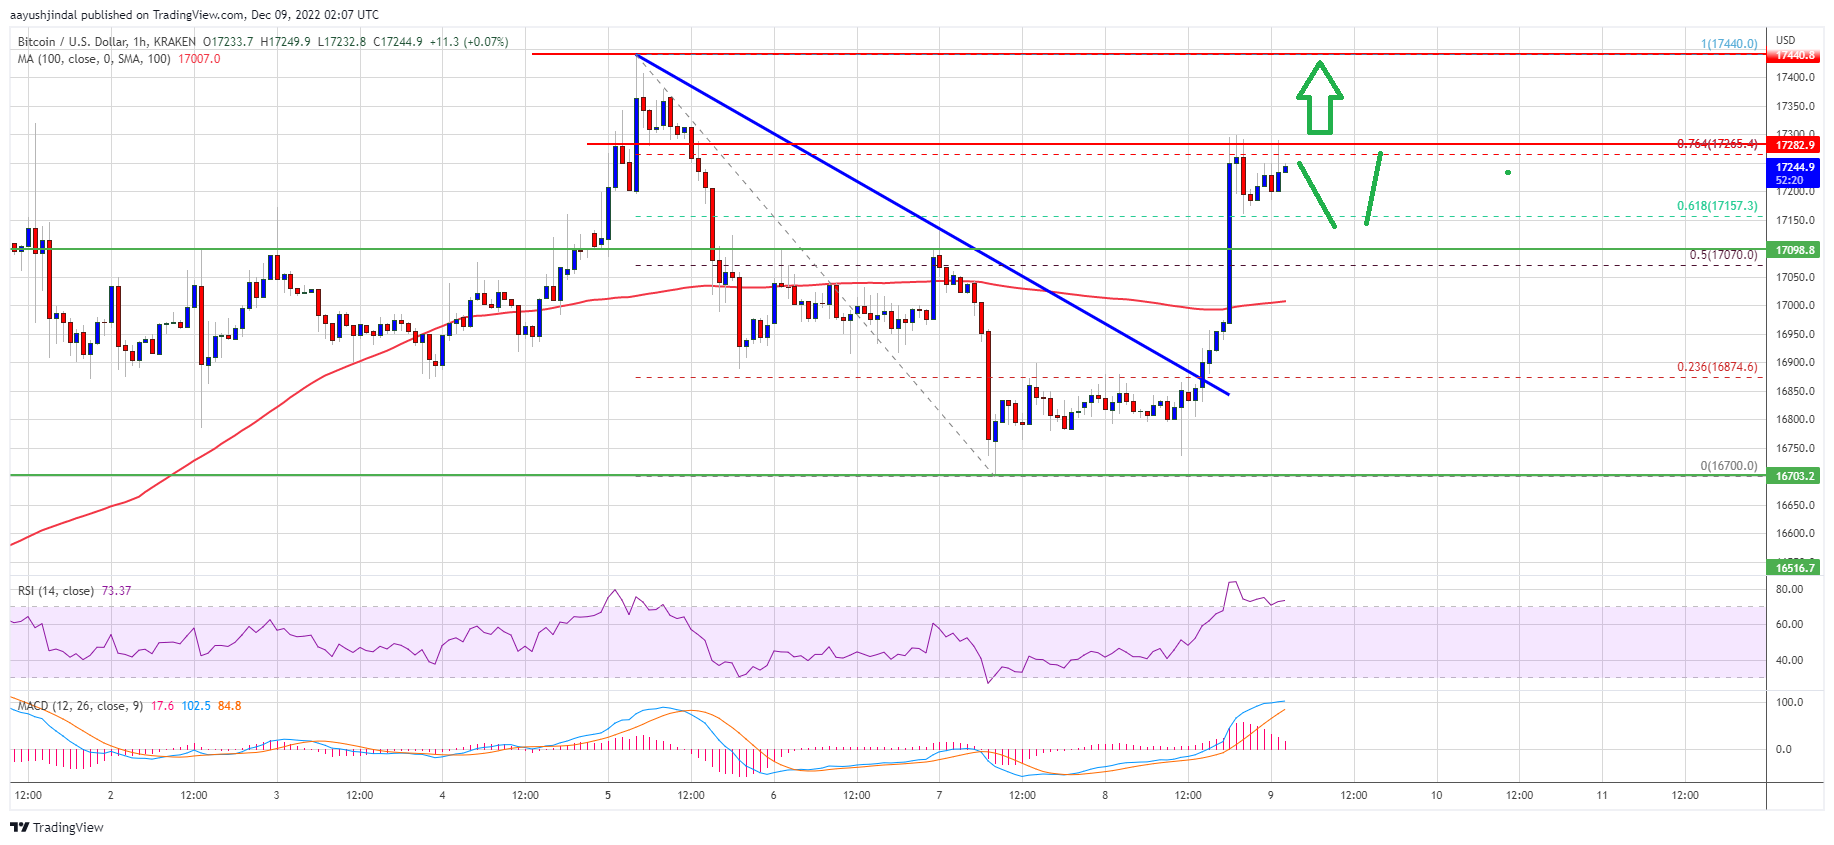
On the upside, an immediate resistance is near the $17,280 level. The first major resistance is near the $17,450 zone, above which the price may perhaps start another steady increase. In the stated case, the price could rise towards the $18,000 resistance. The next major resistance is near $18,250, above which the price rise towards the $18,500 zone in the near term.
Dips Supported in BTC?
If bitcoin fails to clear the $17,280 resistance, there could be a fresh bearish reaction. An immediate support on the downside is near the $17,100 level.
The next major support is near the $17,000 zone and the 100 hourly simple moving average. A downside break below the $17,000 support might call a drop towards $16,700. Any more losses might push the price towards the $16,200 zone in the near term.
Technical indicators:
Hourly MACD – The MACD is now gaining pace in the bullish zone.
Hourly RSI (Relative Strength Index) – The RSI for BTC/USD is now in the overbought zone.
Major Support Levels – $17,000, followed by $16,700.
Major Resistance Levels – $17,280, $17,500 and $18,000.[/vc_column_text][/vc_column][/vc_row]


