
Reason to trust
How Our News is Made
Strict editorial policy that focuses on accuracy, relevance, and impartiality
Ad discliamer
Morbi pretium leo et nisl aliquam mollis. Quisque arcu lorem, ultricies quis pellentesque nec, ullamcorper eu odio.
Bitcoin price is struggling to clear the $24,500 resistance zone. BTC must clear the $24,500 resistance and the 100 hourly SMA to start a decent increase.
- Bitcoin is still struggling to clear the $24,500 resistance zone.
- The price is trading below $24,500 and the 100 hourly simple moving average.
- There is a new bearish trend line forming with resistance near $24,120 on the hourly chart of the BTC/USD pair (data feed from Kraken).
- The pair could rise steadily if it clears the 100 hourly SMA and $24,500.
Bitcoin Price Consolidates Below $24,500
Bitcoin price attempted a fresh increase above the $24,200 resistance. BTC even spiked above the $24,500 resistance zone the 100 hourly simple moving average.
However, there was no upside continuation above $24,500. A high was formed near $24,602 and the price declined again. There was a sharp decline below $24,000 and the price retested the $23,600 support zone. A low is formed near $23,615 and the price is now consolidating.
Bitcoin price trading below $24,500 and the 100 hourly simple moving average. There is also a new bearish trend line forming with resistance near $24,120 on the hourly chart of the BTC/USD pair.
An immediate resistance is near the trend line zone and $24,100. It is near the 50% Fib retracement level of the recent decline from the $24,602 swing high to $23,615 low. The first major resistance is still near the $24,500 zone and the 100 hourly simple moving average.
The next major resistance might $24,840 or the 1.236 Fib extension level of the recent decline from the $24,602 swing high to $23,615 low. A clear move above the $24,840 resistance might send the price towards the key $25,000 resistance zone.
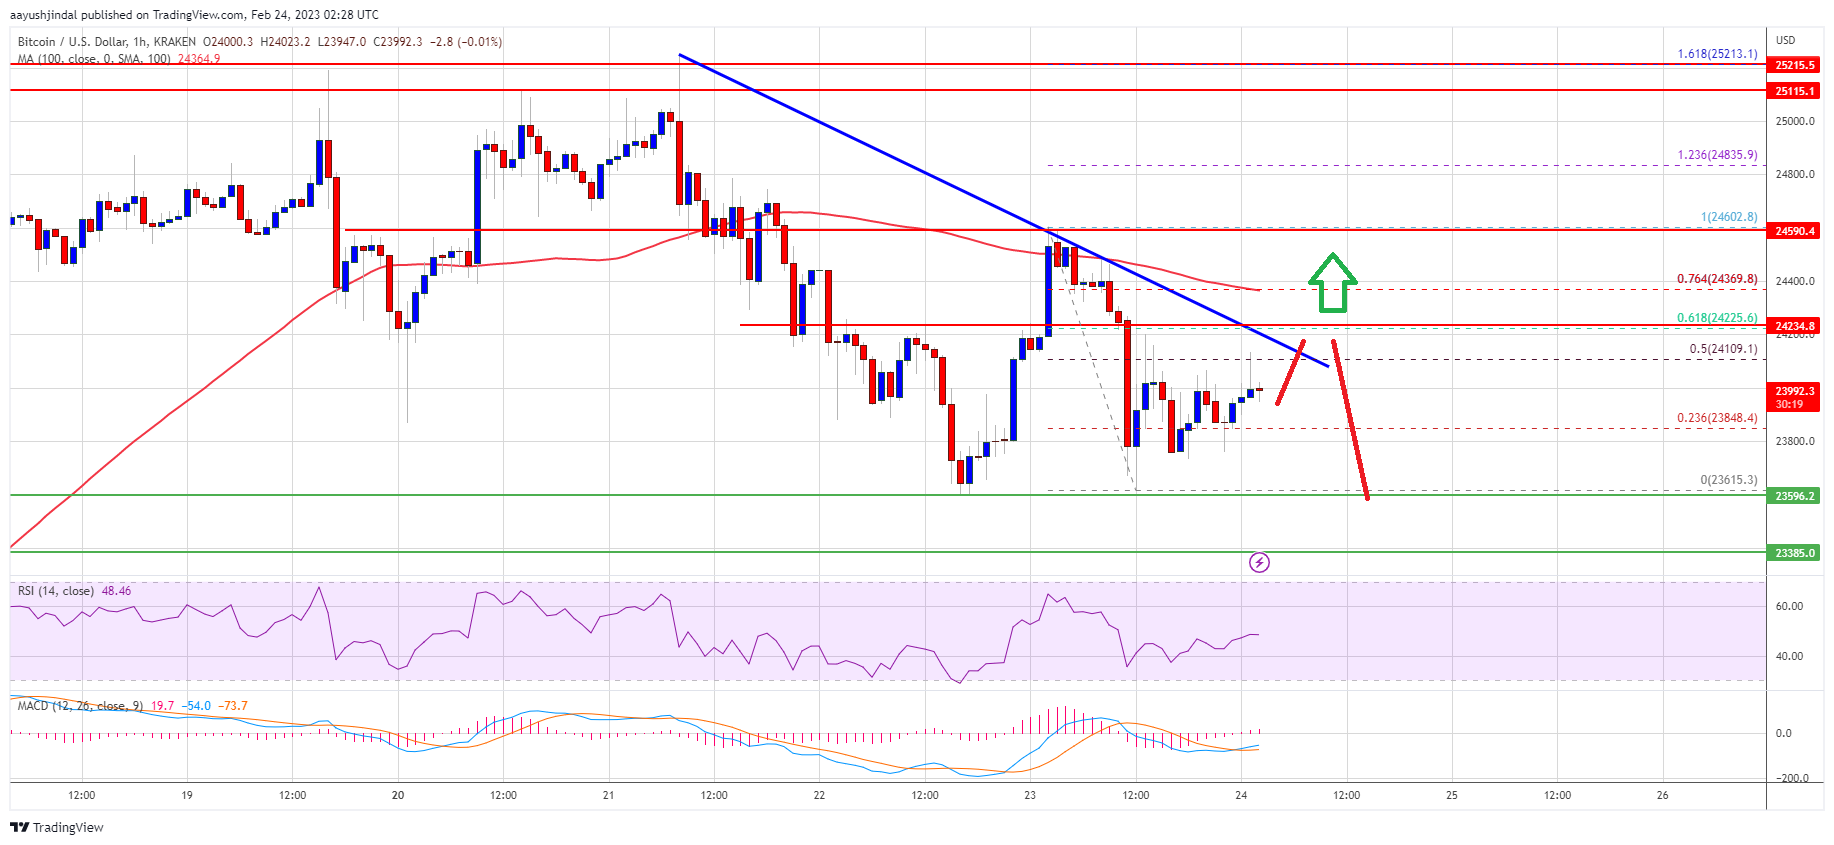
Source: BTCUSD on TradingView.com
A close above the $25,000 resistance could set the pace for a decent increase. In the stated case, the price may perhaps rise towards the $26,200 level.
More Losses in BTC?
If bitcoin price fails to clear the $24,500 resistance, it could continue to move down. An immediate support on the downside is near the $23,600 zone.
The next major support is near the $23,500 zone. If there is a downside break, the price might decline towards $22,000. The next major support is near the $21,500 level.
Technical indicators:
Hourly MACD – The MACD is now losing pace in the bullish zone.
Hourly RSI (Relative Strength Index) – The RSI for BTC/USD is now below the 50 level.
Major Support Levels – $23,600, followed by $23,500.
Major Resistance Levels – $24,120, $24,500 and $25,000.


