
Reason to trust
How Our News is Made
Strict editorial policy that focuses on accuracy, relevance, and impartiality
Ad discliamer
Morbi pretium leo et nisl aliquam mollis. Quisque arcu lorem, ultricies quis pellentesque nec, ullamcorper eu odio.
Bitcoin price is moving lower and trading below $25,000. BTC remains at a risk of a downside break if it stays below the $25,200 resistance zone.
- Bitcoin started a downside correction below the $25,500 support zone.
- The price is trading above $24,000 and the 100 hourly simple moving average.
- There is a key bearish trend line forming with resistance near $24,500 on the hourly chart of the BTC/USD pair (data feed from Kraken).
- The pair could start a fresh increase if it stays above the $23,500 support zone.
Bitcoin Price Trims Gains
Bitcoin price started a downside correction from the $26,500 resistance zone. BTC declined below the $25,500 and $25,000 support levels to move into a short-term bearish zone.
The price even declined below the $24,000 level and traded as low as $23,913. It is now consolidating in a range above the $24,000 level. It is trading near the 23.6% Fib retracement level of the recent decline from the $26,526 swing high to $23,913 low.
Besides, bitcoin price is now trading above $24,000 and the 100 hourly simple moving average. There is also a key bearish trend line forming with resistance near $24,500 on the hourly chart of the BTC/USD pair.
Clearly, the price is near an inflection zone, with an immediate resistance near the $24,500 level. The next major resistance is near the $25,200 zone. It is near the 50% Fib retracement level of the recent decline from the $26,526 swing high to $23,913 low.
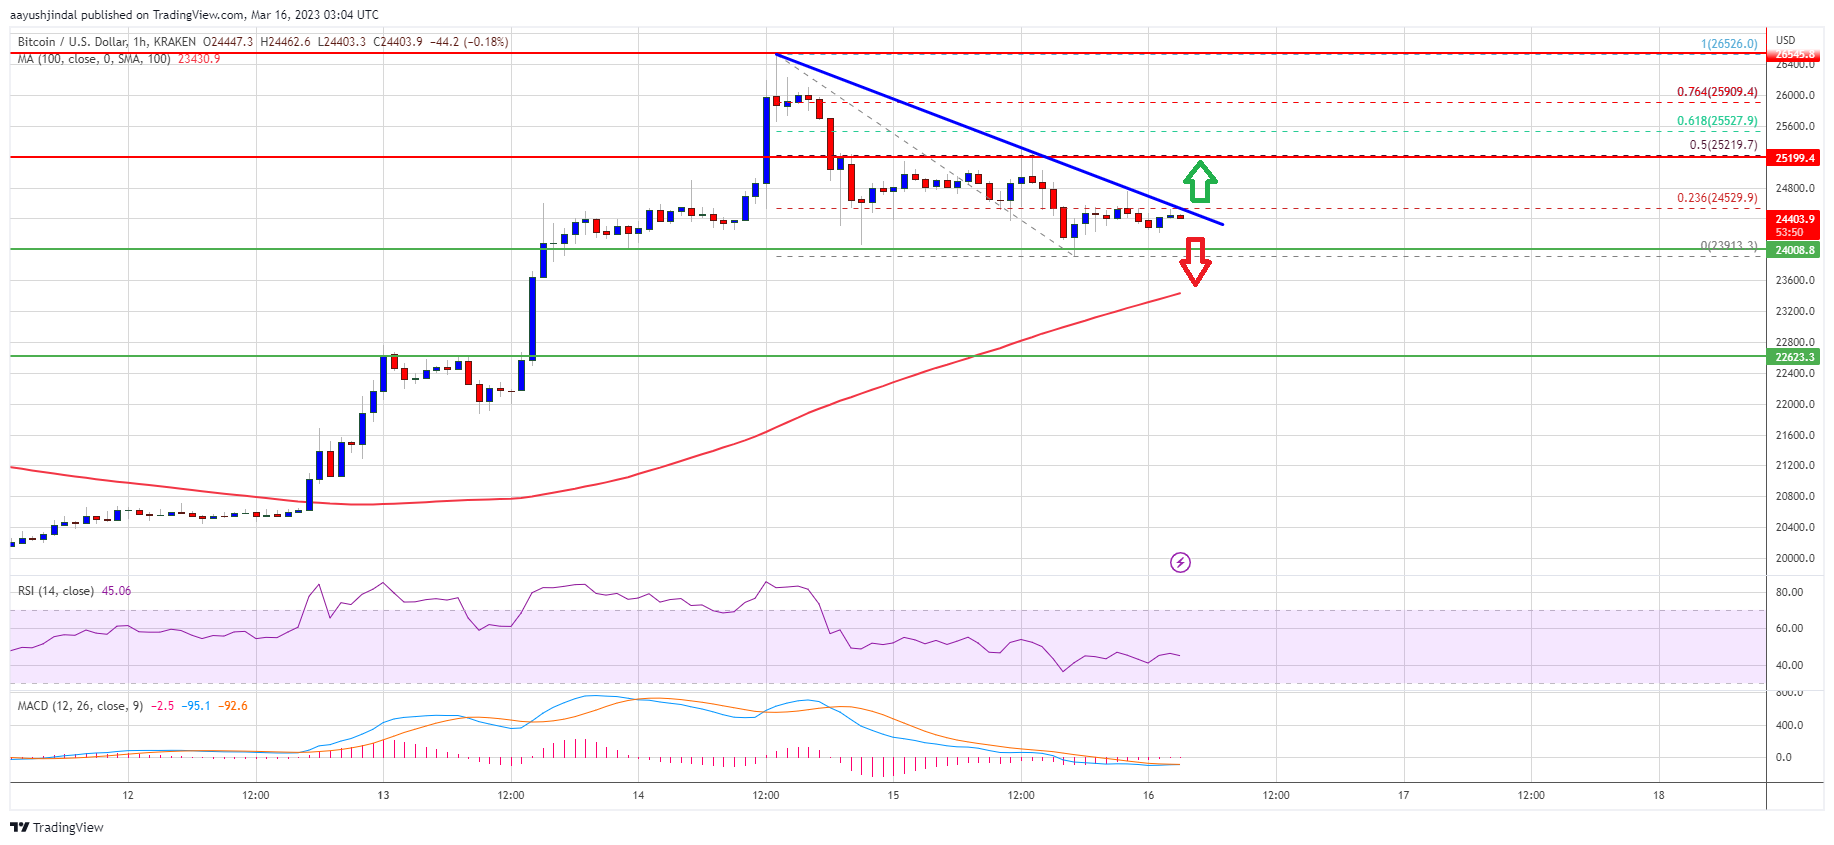
Source: BTCUSD on TradingView.com
A close above the $25,200 resistance might start a fresh increase towards the $26,000 resistance. The next key resistance is near the $26,500 zone, above which the price might rise towards $27,500.
Downside Break in BTC?
If bitcoin price fails to clear the $25,200 resistance, it could start another decline. An immediate support on the downside is near the $24,000 zone.
The next major support is near the $23,500 zone and the 100 hourly simple moving average, below which the price gain bearish momentum. The next major support is near the $22,600 level. Any more losses might send the price towards the $22,000 level.
Technical indicators:
Hourly MACD – The MACD is now losing pace in the bearish zone.
Hourly RSI (Relative Strength Index) – The RSI for BTC/USD is now below the 50 level.
Major Support Levels – $24,000, followed by $23,500.
Major Resistance Levels – $24,500, $25,200 and $26,000.


