
Reason to trust
How Our News is Made
Strict editorial policy that focuses on accuracy, relevance, and impartiality
Ad discliamer
Morbi pretium leo et nisl aliquam mollis. Quisque arcu lorem, ultricies quis pellentesque nec, ullamcorper eu odio.
Bitcoin price gained bullish momentum above $50K and traded to a new all-time high at $57,500 against the US Dollar. BTC remains supported and it is likely eyeing a test of $60,000.
- Bitcoin climbed above the $50,000 resistance and traded to a new all-time high near USD 57,500.
- The price is trading nicely above the $55,000 level and the 100 simple moving average (4-hours).
- There is a key bullish trend line forming with support near $54,000 on the 4-hours chart of the BTC/USD pair (data feed from Kraken).
- The pair is showing a lot of positive signs and the bulls seems to eyeing a test of $60,000.
Bitcoin Price is Gaining Traction
This past week, bitcoin price extended its rise above the key $50,000 resistance zone against the US Dollar. The BTC/USD pair even broke the $55,000 level and settled well above the 100 simple moving average (4-hours).
It traded to a new all-time high near $57,500 and recently started a downside correction. There was a sharp dip below the $56,000 and $55,000 levels. The price broke the 23.6% Fib retracement level of the upward move from the $50,634 swing low to $57,500 high.
However, the bulls were active near the $54,000 support level. The 50% Fib retracement level of the upward move from the $50,634 swing low to $57,500 high also acted as a decent support.
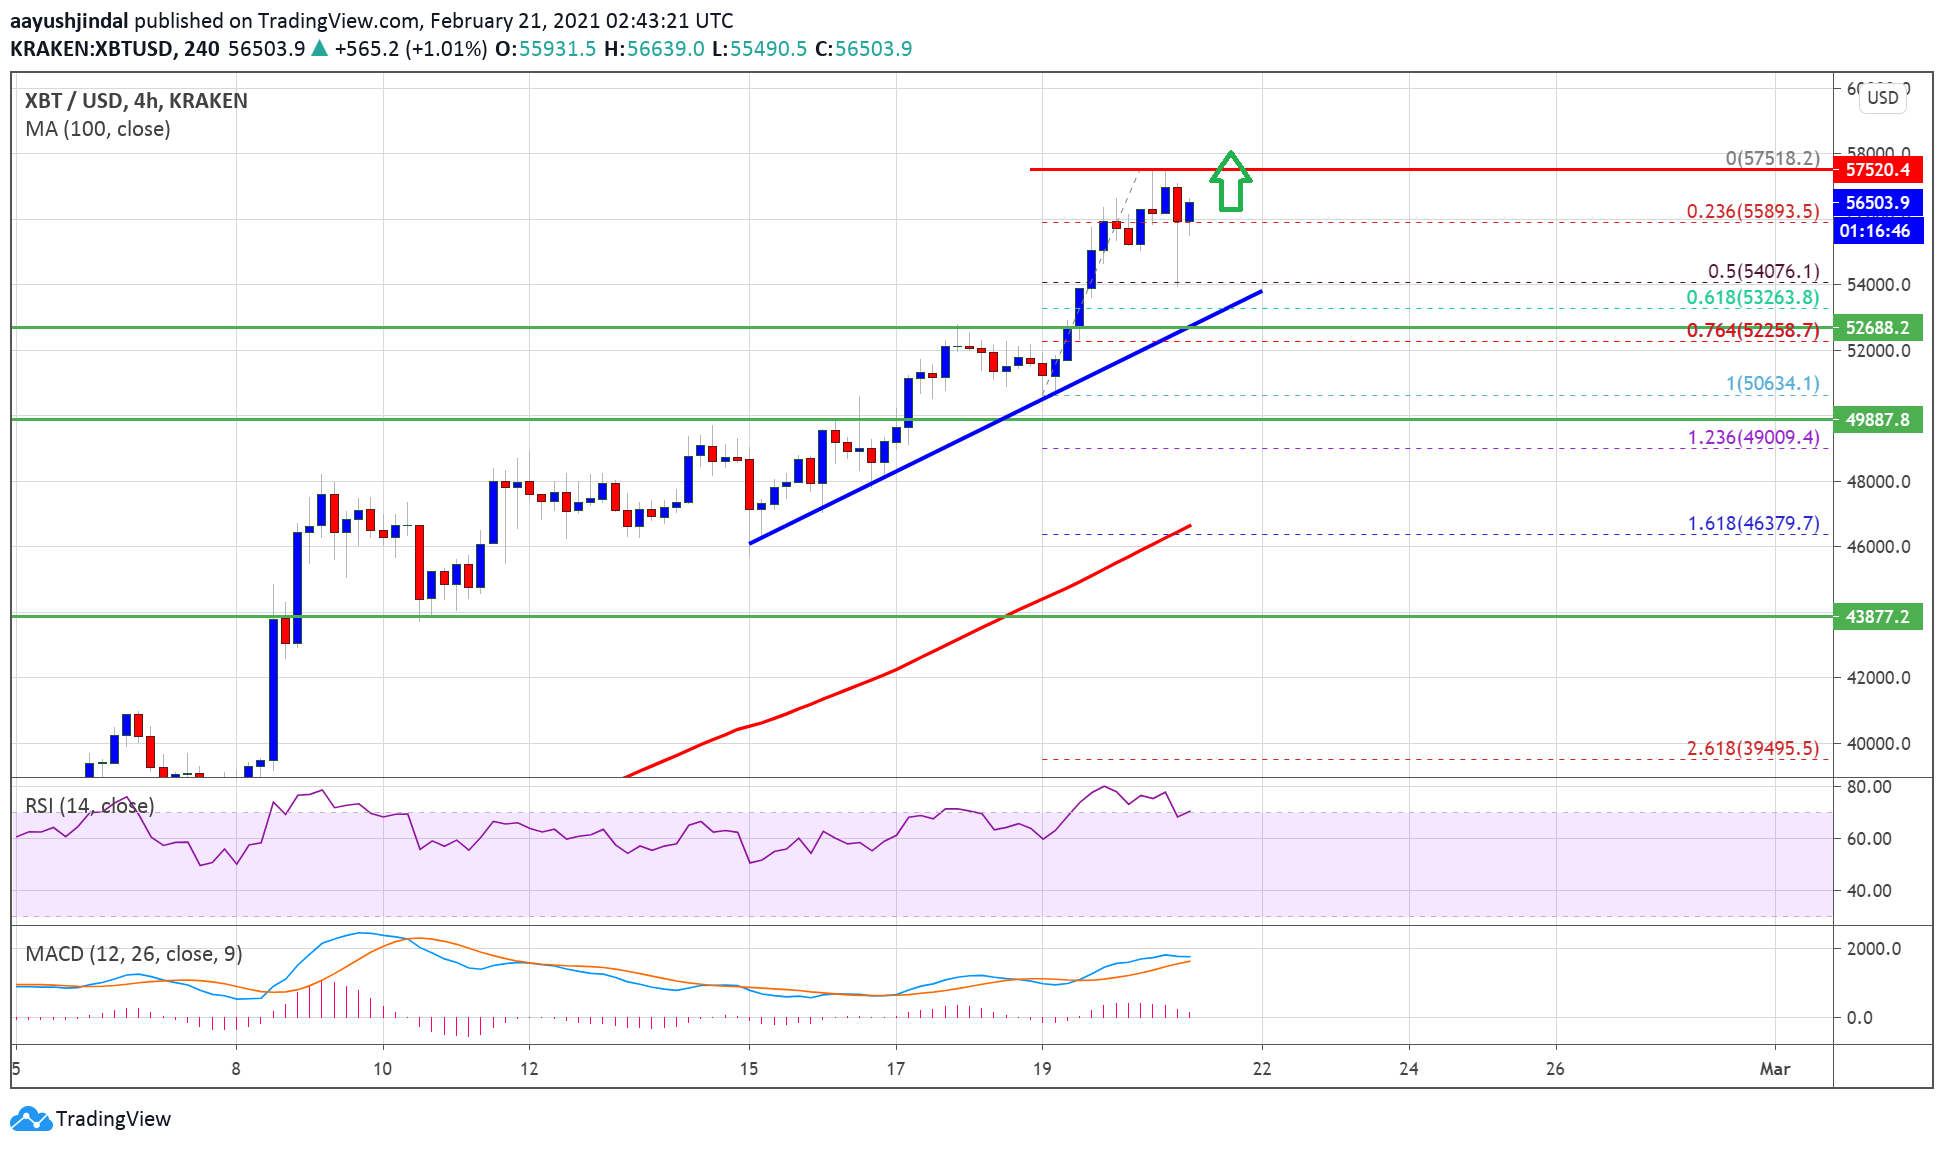
There is also a key bullish trend line forming with support near $54,000 on the 4-hours chart of the BTC/USD pair. The pair is also recovering and trading nicely above $55,000. An initial resistance is near the $57,000 level. The first major resistance is near the $57,500 high.
A clear break above the $57,500 resistance is likely to open the doors for more upsides. The next major resistance for the bulls sits at $60,000.
Dips Supported in BTC?
If bitcoin struggles to clear the $57,500 resistance level, there are chances of a downside correction. The first major support is near the trend line and $54,000.
The next major support is near the $52,500 level (a multi-touch zone). If there is a clear break and close below the $52,500 support, the price could decline towards the $50,000 level in the near term.
Technical indicators
4 hours MACD – The MACD for BTC/USD is showing positive signs in the bullish zone.
4 hours RSI (Relative Strength Index) – The RSI for BTC/USD is still above the 60 level.
Major Support Level – $52,500
Major Resistance Level – $60,000


