
Reason to trust
How Our News is Made
Strict editorial policy that focuses on accuracy, relevance, and impartiality
Ad discliamer
Morbi pretium leo et nisl aliquam mollis. Quisque arcu lorem, ultricies quis pellentesque nec, ullamcorper eu odio.
Bitcoin price is moving higher above the $26,200 resistance. BTC could gain bullish momentum if there is a daily close above the $26,500 resistance.
- Bitcoin is showing a few positive signs above the $26,200 level.
- The price is trading above $26,000 and the 100 hourly Simple moving average.
- There is a connecting bullish trend line forming with support near $26,050 on the hourly chart of the BTC/USD pair (data feed from Kraken).
- The pair could start a fresh rally if there is a close above $26,500 and then a move above $27,000.
Bitcoin Price Eyes Upside Break
Bitcoin price remained well-bid above the $25,500 support zone. BTC formed a base and recently started a fresh increase above the $26,000 resistance zone.
There was a sharp spike above the $26,500 resistance zone. However, there was no close above the $26,500 resistance zone. The price traded as high as $27,212 and there was a nasty bearish reaction. The price reversed its gains and traded below the $26,650 level.
There was a move below the 23.6% Fib retracement level of the upward move from the $24,925 swing low to the $27,212 high. Bitcoin is now trading above $26,000 and the 100 hourly Simple moving average.
Besides, there is a connecting bullish trend line forming with support near $26,050 on the hourly chart of the BTC/USD pair. Immediate resistance on the upside is near the $26,500 level. The first major resistance is near the $26,650 level.
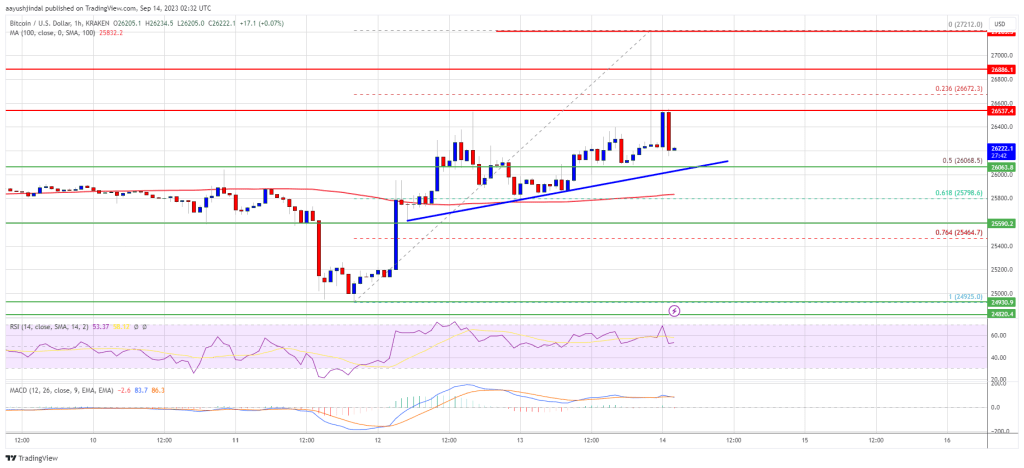
Source: BTCUSD on TradingView.com
The next key resistance could be near the $27,200 level. A proper close above the $26,500 level and then a break above $27,200 might start a decent increase. The next major resistance is near $28,000, above which the bulls could gain strength. In the stated case, the price could test the $28,800 level.
Fresh Drop In BTC?
If Bitcoin fails to start a fresh increase above the $26,500 resistance, it could continue to move down. Immediate support on the downside is near the $26,050 level and the trend line.
The next major support is near the $25,800 level or the 61.8% Fib retracement level of the upward move from the $24,925 swing low to the $27,212 high. A downside break and close below the $25,800 level might send the price toward the key support at $25,550.
Technical indicators:
Hourly MACD – The MACD is now losing pace in the bullish zone.
Hourly RSI (Relative Strength Index) – The RSI for BTC/USD is now above the 50 level.
Major Support Levels – $26,050, followed by $25,800.
Major Resistance Levels – $26,500, $26,650, and $27,200.


