
Reason to trust
How Our News is Made
Strict editorial policy that focuses on accuracy, relevance, and impartiality
Ad discliamer
Morbi pretium leo et nisl aliquam mollis. Quisque arcu lorem, ultricies quis pellentesque nec, ullamcorper eu odio.
Bitcoin price is moving lower from the $30,200 zone. BTC is signaling a fresh decline and there is a risk of a drop toward the $28,500 support.
- Bitcoin is struggling to remain in a positive zone above $29,200.
- The price is trading below $29,500 and the 100 hourly Simple moving average.
- There is a connecting bearish trend line forming with resistance near $29,450 on the hourly chart of the BTC/USD pair (data feed from Kraken).
- The pair could continue to move down if it breaks the $29,200 support zone.
Bitcoin Price Trims Gains
Bitcoin price faced another rejection above the $30,000 resistance zone. A high was formed near $30,190 and BTC reacted to the downside. There was a move below the $30,000 and $29,800 levels.
The price declined below the 50% Fib retracement level of the key increase from the $28,628 swing low to the $30,190 high. It seems like the bulls are now putting up some fight near the $29,300 zone. Bitcoin is now trading below $29,500 and the 100 hourly Simple moving average.
There is also a connecting bearish trend line forming with resistance near $29,450 on the hourly chart of the BTC/USD pair. If there is a fresh increase, the pair could face resistance near the 100 hourly Simple moving average at $29,400.
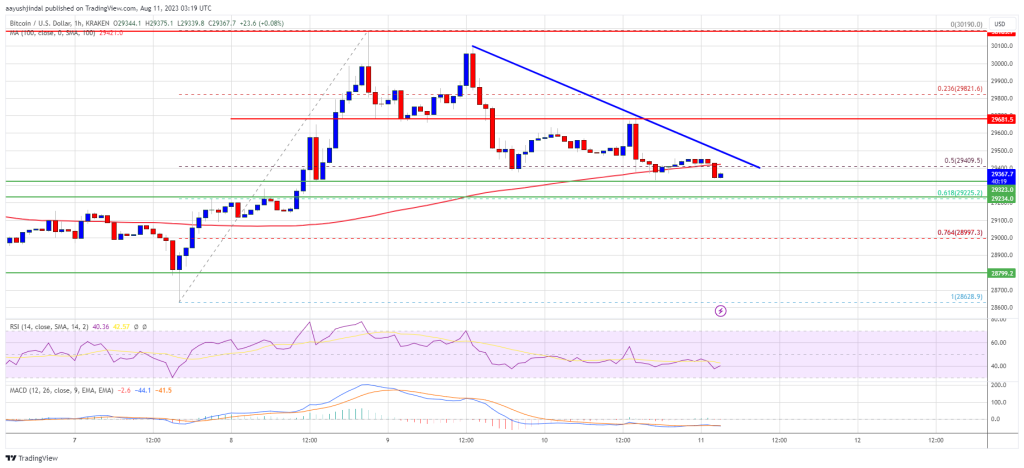
Source: BTCUSD on TradingView.com
The next major resistance is near the trend line and $29,500. A close above the trend line could start a decent increase toward $30,000. To spark a steady uptrend, the price must settle above the $30,000 resistance. In the stated case, the price could rise toward $31,200 or even $32,000 in the coming days.
More Losses In BTC?
If Bitcoin fails to clear the $29,500 resistance, it could continue to move down. Immediate support on the downside is near the $29,320 level.
The next major support is near the $29,220 level or the 61.8% Fib retracement level of the key increase from the $28,628 swing low to the $30,190 high. A downside break below the $29,220 level might spark bearish moves. In the stated case, the price could revisit $29,000. Any more losses might call for a move toward the $28,500 level in the near term.
Technical indicators:
Hourly MACD – The MACD is now gaining pace in the bearish zone.
Hourly RSI (Relative Strength Index) – The RSI for BTC/USD is now below the 50 level.
Major Support Levels – $29,220, followed by $29,000.
Major Resistance Levels – $29,400, $29,500, and $30,000.


