
Reason to trust
How Our News is Made
Strict editorial policy that focuses on accuracy, relevance, and impartiality
Ad discliamer
Morbi pretium leo et nisl aliquam mollis. Quisque arcu lorem, ultricies quis pellentesque nec, ullamcorper eu odio.
Bitcoin price is showing positive signs above $58,500 and $59,500 against the US Dollar. BTC is likely to accelerate higher above $61,000 and $62,000 in the near term.
- Bitcoin gained bullish momentum above the $58,500 and $59,200 resistance levels.
- The price is now trading above the $60,000 support and the 100 simple moving average (4-hours).
- There is a short-term bullish continuation pattern forming with resistance near $60,300 on the 4-hours chart of the BTC/USD pair (data feed from Kraken).
- The pair could start a fresh rally if it clears the $60,500 and $60,800 levels in the near term.
Bitcoin Price is Eyeing More Gains
This past week, bitcoin price saw a decent increase above the $57,500 resistance against the US Dollar. The BTC/USD pair broke the $58,500 resistance and it settled above the 100 simple moving average (4-hours).
The pair even climbed above the $59,200 level and the key $60,000 resistance. However, the bulls struggled to lead the price to a new all-time high above $61,250. A high was formed near $61,242 and the price is now consolidating gains.
There was a spike below the 23.6% Fib retracement level of the upward move from the $55,545 swing low to $61,242 high. The price is now consolidating above the $60,000 level.
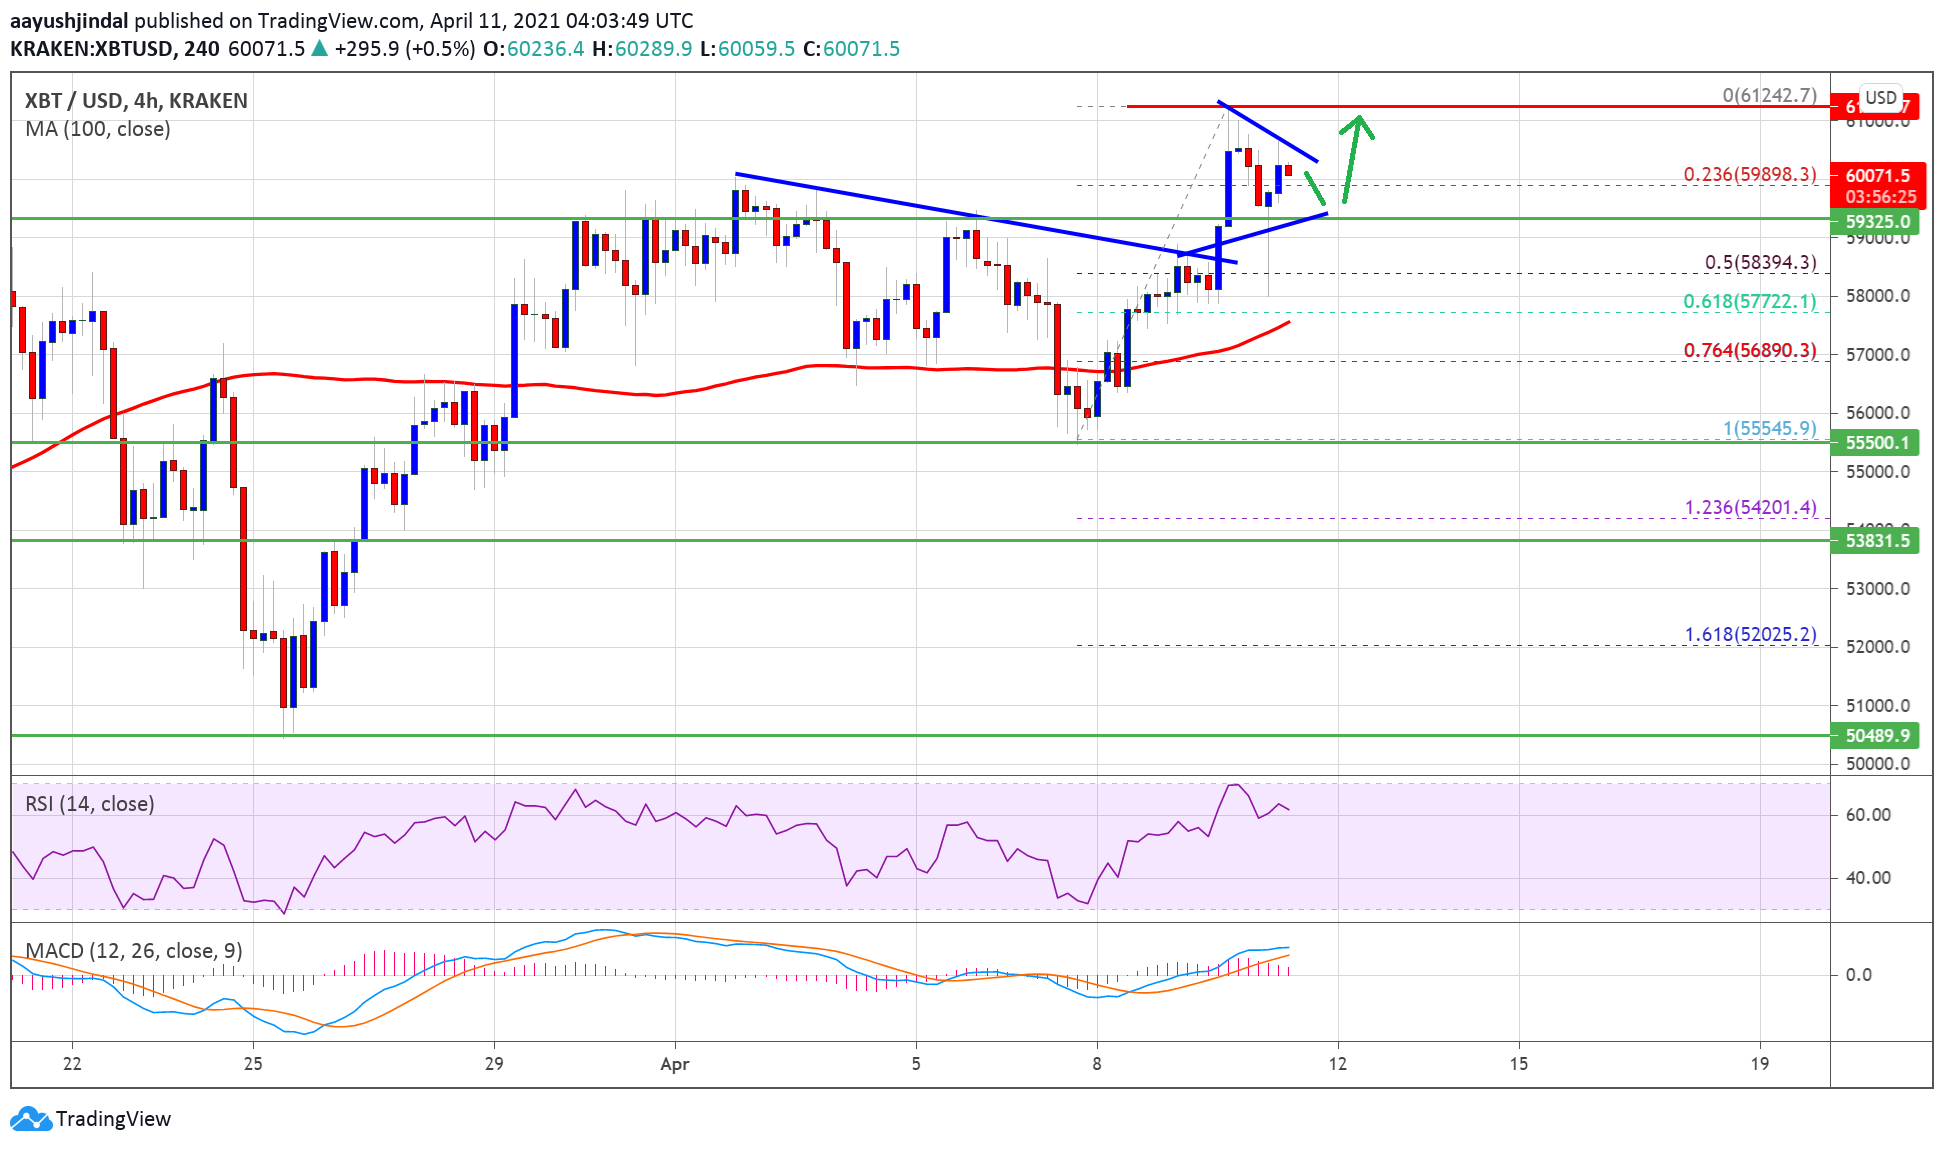
Source: BTCUSD on TradingView.com
There is also a short-term bullish continuation pattern forming with resistance near $60,300 on the 4-hours chart of the BTC/USD pair. If there is an upside break above the $60,500 level, there are chances of a strong increase in the coming sessions.
The next key resistance is near the $61,250 level. A successful push above the $61,250 level could open the doors for a steady increase above $62,000 and to a new all-time high in the near term.
Downside Break in BTC?
If bitcoin fails above the $60,500 support, there is a risk of a downside break. The first major support is near the $59,300 and $59,200 levels.
The next major support is near the $58,500 level. It is near the 50% Fib retracement level of the upward move from the $55,545 swing low to $61,242 high. Any more losses might call for a test of the $57,500 level and the 100 simple moving average (4-hours).
Technical indicators
4 hours MACD – The MACD for BTC/USD is losing momentum in the bullish zone.
4 hours RSI (Relative Strength Index) – The RSI for BTC/USD is now well above the 50 level.
Major Support Level – $58,500
Major Resistance Level – $61,250


