
Reason to trust
How Our News is Made
Strict editorial policy that focuses on accuracy, relevance, and impartiality
Ad discliamer
Morbi pretium leo et nisl aliquam mollis. Quisque arcu lorem, ultricies quis pellentesque nec, ullamcorper eu odio.
Bitcoin price is showing a few positive signs above $48,000 against the US Dollar. BTC is likely to start a strong increase if it settles above $50,000 and the 100 SMA (H4).
- Bitcoin remained well bid above $43,000 and $45,000 support levels.
- The price is now approaching the $50,000 resistance and the 100 simple moving average (4-hours).
- There is a key contracting triangle forming with resistance near $50,200 on the 4-hours chart of the BTC/USD pair (data feed from Kraken).
- The pair is likely to start a strong increase if it clears the $50,000 and $50,500 resistance levels.
Bitcoin Price is Gaining Momentum
This past week, bitcoin price corrected lower below the $48,000 support zone against the US Dollar. The BTC/USD pair even broke the $47,000 level and settled below the 100 simple moving average (4-hours).
However, the bulls were able to protect a downside break below the $46,000 area. A low was formed near $46,350 before the price started a fresh increase. It cleared the $47,000 and $48,000 resistance levels. There was also a break above the 50% Fib retracement level of the downward move from the $52,640 swing high to $46,350 low.
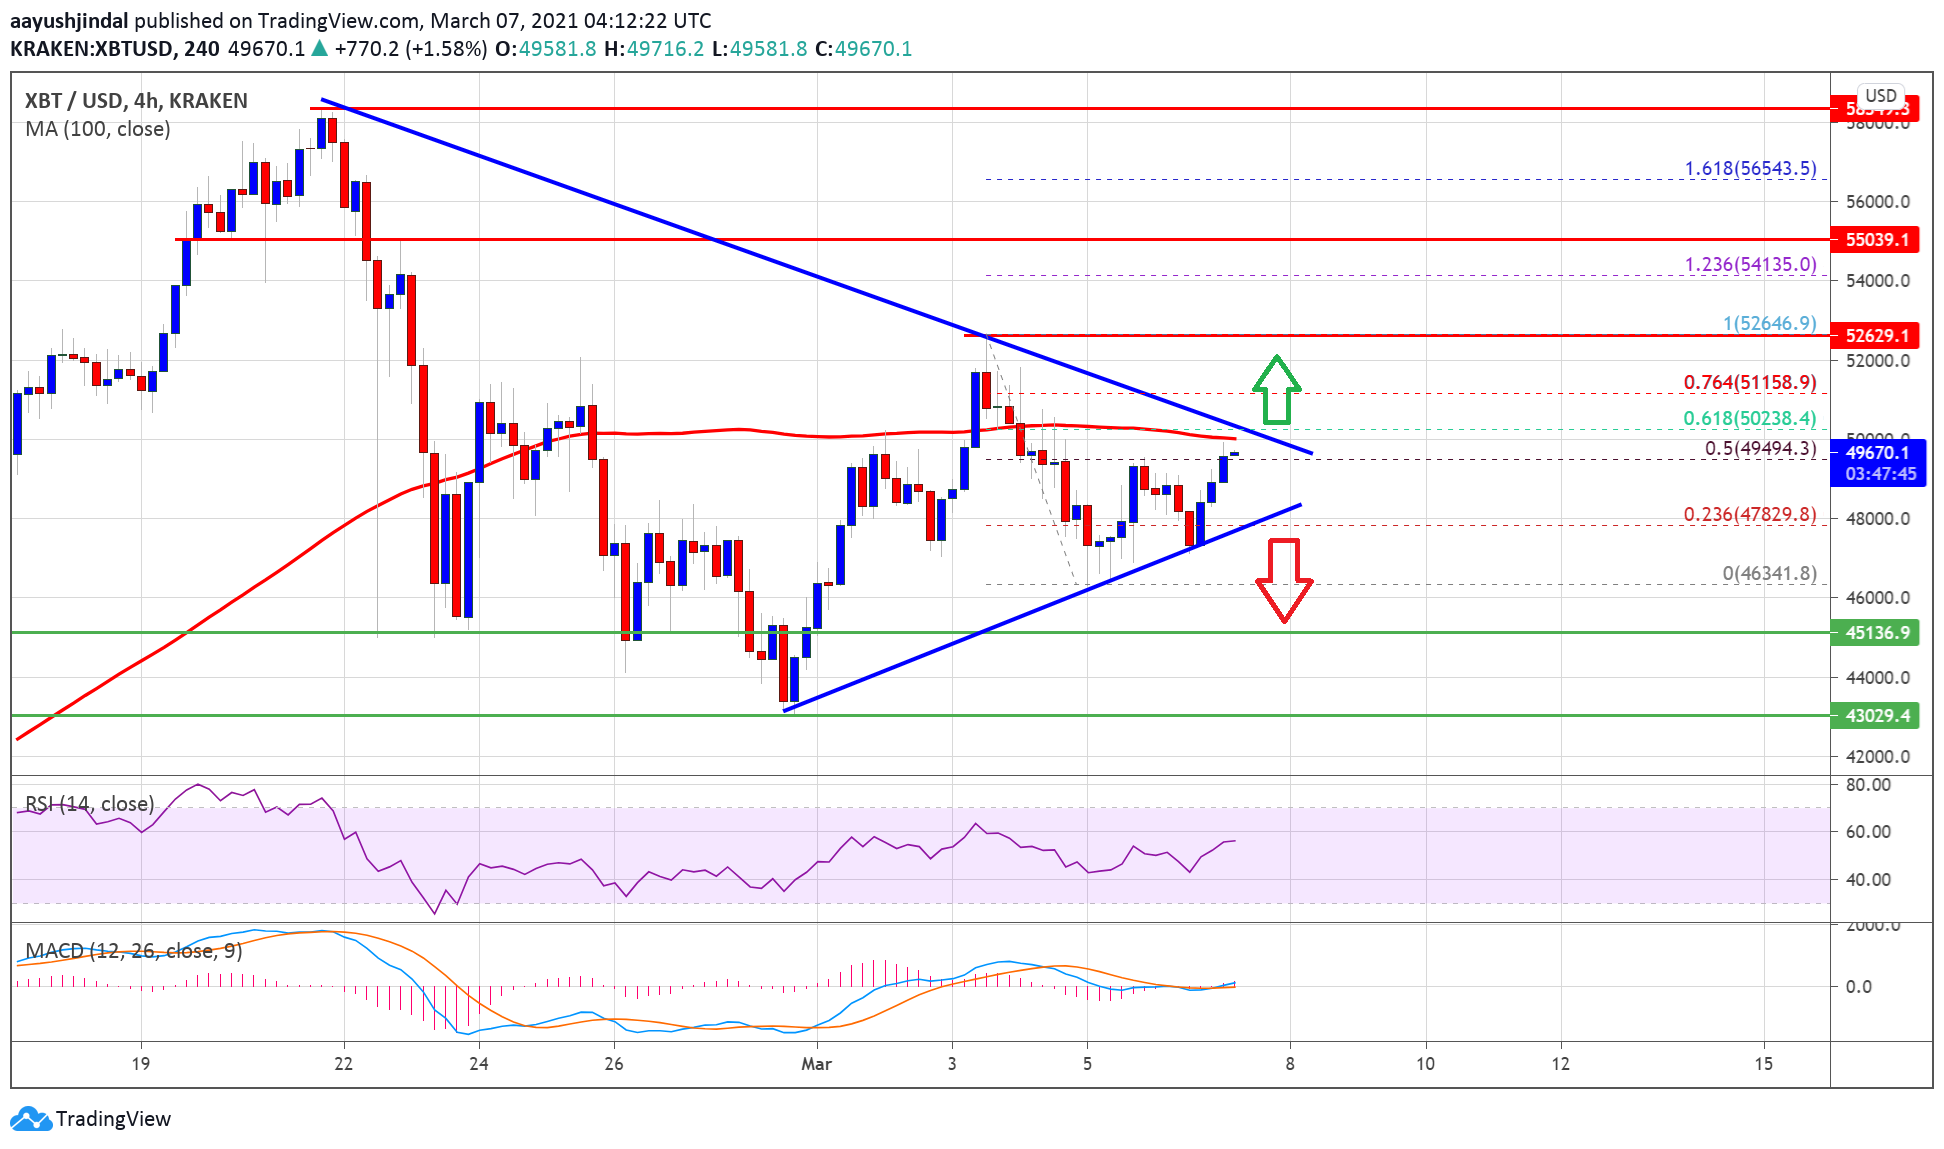
Source: BTCUSD on TradingView.com
It is now approaching the $50,000 resistance and the 100 simple moving average (4-hours). There is also a key contracting triangle forming with resistance near $50,200 on the 4-hours chart of the BTC/USD pair.
The triangle resistance is close to the 61.8% Fib retracement level of the downward move from the $52,640 swing high to $46,350 low. A clear break above the triangle resistance could open the doors for a fresh increase towards the $52,000 and $53,000 resistance levels. The next major hurdle for bitcoin could be near $55,000.
Limited Downsides in BTC?
If bitcoin fails toc clear the $50,000 and $50,500 resistance levels, it could correct lower. The first key support is near the $48,800 level.
The main support is near the triangle lower trend line and $48,000. A clear break below the triangle support zone could clear the path for a move towards the $45,00 support zone in the near term.
Technical indicators
4 hours MACD – The MACD for BTC/USD is showing positive signs in the bullish zone.
4 hours RSI (Relative Strength Index) – The RSI for BTC/USD is now well above the 50 level.
Major Support Level – $48,000
Major Resistance Level – $50,000


