
Reason to trust
How Our News is Made
Strict editorial policy that focuses on accuracy, relevance, and impartiality
Ad discliamer
Morbi pretium leo et nisl aliquam mollis. Quisque arcu lorem, ultricies quis pellentesque nec, ullamcorper eu odio.
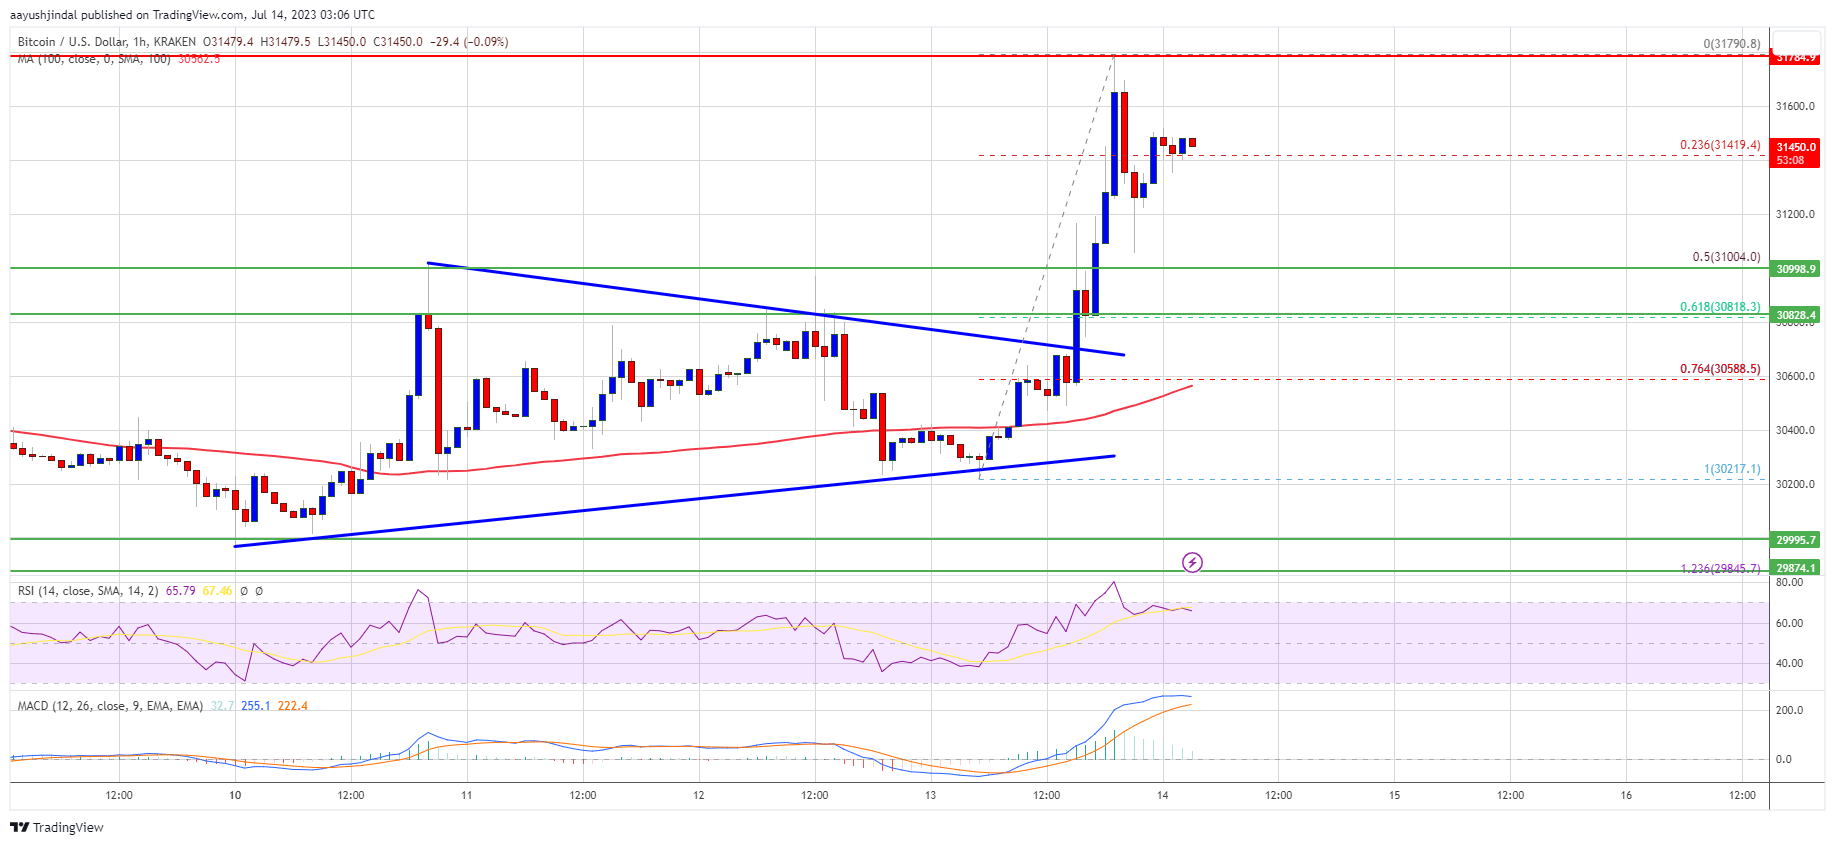
Bitcoin price started a fresh increase after XRP’s massive rally. BTC is trading above $31,400 and might rally if there is a close above $32,000.
- Bitcoin is moving higher above the $31,000 and $31,400 resistance levels.
- The price is trading above $31,000 and the 100 hourly Simple moving average.
- There was a break above a key contracting triangle with resistance near $30,700 on the hourly chart of the BTC/USD pair (data feed from Kraken).
- The pair could gain bullish momentum if there is a close above $32,000.
Bitcoin Price Starts Fresh Increase
Bitcoin price was able to clear the $30,500 resistance zone. BTC started a fresh increase after a court ruling in favor of Ripple, stating XRP is not a security. There was a break above the $30,650 resistance.
Besides, there was a break above a key contracting triangle with resistance near $30,700 on the hourly chart of the BTC/USD pair. The pair even climbed above the $31,400 resistance zone. A high is formed near $31,790 and the price is now consolidating gains.
It is trading near the 23.6% Fib retracement level of the recent increase from the $30,217 swing low to the $31,790 high. Bitcoin is now trading above $31,000 and the 100 hourly Simple moving average.
Source: BTCUSD on TradingView.com
Immediate resistance is near the $31,600 level. The first major resistance is near $31,800, above which the price could gain bullish momentum. In the stated case, BTC might rise toward the $32,000 resistance. The next major resistance is near the $32,500 level. Any more gains could open the doors for a move toward the $33,200 resistance zone.
Are Dips Supported in BTC?
If Bitcoin fails to clear the $31,800 resistance, it could start a downside correction. Immediate support on the downside is near the $31,200 level.
The next major support is near the $31,000 level or the 50% Fib retracement level of the recent increase from the $30,217 swing low to the $31,790 high, below which there could be a drop toward the $30,800 support zone. Any more losses might send the price toward the $30,550 level in the near term.
Technical indicators:
Hourly MACD – The MACD is now losing pace in the bullish zone.
Hourly RSI (Relative Strength Index) – The RSI for BTC/USD is now above the 50 level.
Major Support Levels – $31,200, followed by $31,000.
Major Resistance Levels – $31,650, $31,800, and $32,000.


