
Reason to trust
How Our News is Made
Strict editorial policy that focuses on accuracy, relevance, and impartiality
Ad discliamer
Morbi pretium leo et nisl aliquam mollis. Quisque arcu lorem, ultricies quis pellentesque nec, ullamcorper eu odio.
Bitcoin price is consolidating above the $59,500 support zone against the US Dollar. BTC is now showing a few positive signs, but it must clear $61,200 for a fresh rally in the near term.
- Bitcoin is holding gains above the $60,000 and $59,500 support levels.
- The price is now trading well above the $59,500 level and the 100 hourly simple moving average.
- There is a key bullish trend line forming with support near $59,400 on the hourly chart of the BTC/USD pair (data feed from Kraken).
- The pair is likely to start a sharp upward move once it clears the $60,800 and $61,200 levels.
Bitcoin Price is Showing Positive Signs
Bitcoin remained in a range above the $59,000 level and it is showing a few positive signs. Recently, BTC made another attempt to clear the $61,200 resistance, but it failed.
It corrected lower and retested the $59,500 support level. A low is formed near $59,432 and the price is now moving higher. It is also trading well above the $59,500 level and the 100 hourly simple moving average.
There was a break above the 50% Fib retracement level of the recent decline from the $61,212 high to $59,432 low. There is also a key bullish trend line forming with support near $59,400 on the hourly chart of the BTC/USD pair.
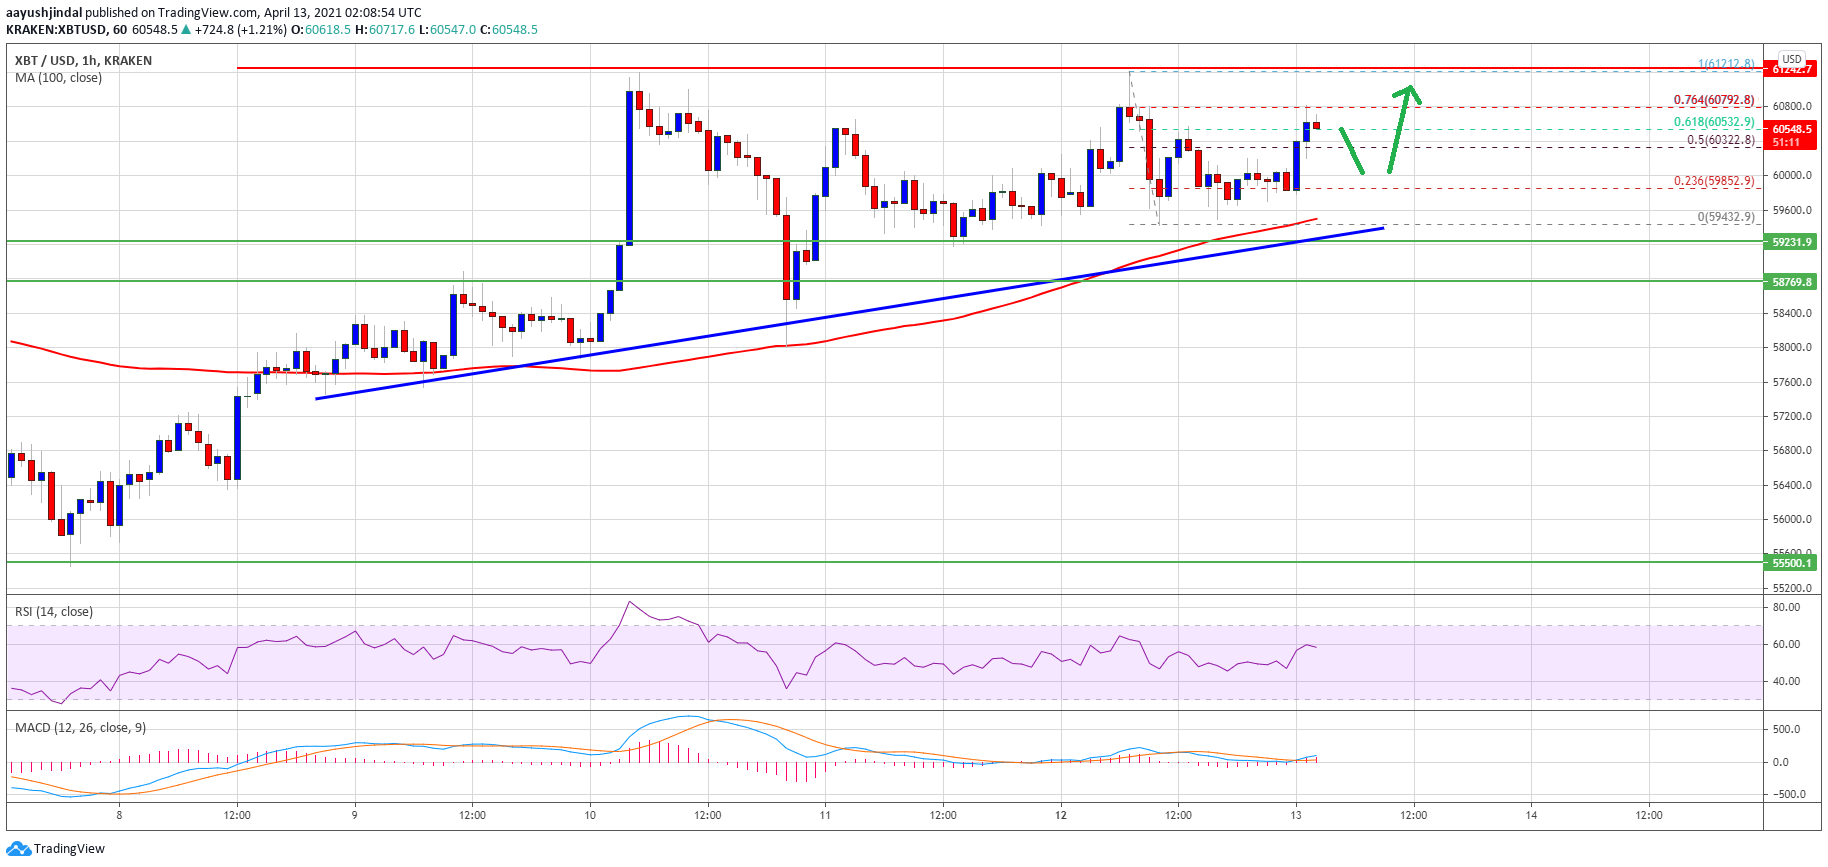
Source: BTCUSD on TradingView.com
Bitcoin is now trading above $60,400, but it is facing resistance near $60,800. It is close to the 76.4% Fib retracement level of the recent decline from the $61,212 high to $59,432 low.
A successful break above the $60,800 level could open the doors for a move above $61,200. If the bulls succeed in clearing $61,200, the price could rally in the coming sessions.
Dips Limited in BTC?
If bitcoin fails to climb above $60,800 and $61,200, there could be a short-term downside correction. An initial support on the downside is near the $60,000 level.
The main support is now forming near the trend line, $59,500 and the 100 hourly simple moving average. If the bulls fail to protect the 100 hourly SMA, there could be a major decline. In this case, the price might decline towards the $58,000 level.
Technical indicators:
Hourly MACD – The MACD is now gaining momentum in the bullish zone.
Hourly RSI (Relative Strength Index) – The RSI for BTC/USD is now well above the 50 level.
Major Support Levels – $59,500, followed by $59,000.
Major Resistance Levels – $60,800, $61,200 and $62,000.


