
Reason to trust
How Our News is Made
Strict editorial policy that focuses on accuracy, relevance, and impartiality
Ad discliamer
Morbi pretium leo et nisl aliquam mollis. Quisque arcu lorem, ultricies quis pellentesque nec, ullamcorper eu odio.
Bitcoin price managed to stay above the $10,550 support and climbed above $10,800 against the US Dollar. BTC is now facing the main hurdle near the $10,950 and $11,000 levels.
- Bitcoin is up over 2% and it found a strong buying interest near the $10,550 support level.
- The price is trading above the 100 hourly simple moving average, but facing hurdles near $10,950.
- There was a break above a major bearish trend line with resistance near $10,635 on the hourly chart of the BTC/USD pair (data feed from Kraken).
- The pair could rally if it clear the $10,950 and $11,000 resistance levels.
Bitcoin Price is Attempting Bullish Breakout
Bitcoin price made another attempt to clear the $10,550 support against the US Dollar. However, BTC remained well bid above the $10,550 support level, resulting in a fresh bullish reaction.
There was a break above the $10,650 and $10,700 resistance levels to start a decent upward move. More importantly, there was a break above a major bearish trend line with resistance near $10,635 on the hourly chart of the BTC/USD pair.
Bitcoin is up over 2% and it cleared the $10,800 resistance level. The upward move was such that the price even spiked above the $10,950 resistance. A new intraday high is formed near $10,971 and the price is currently consolidating gains.
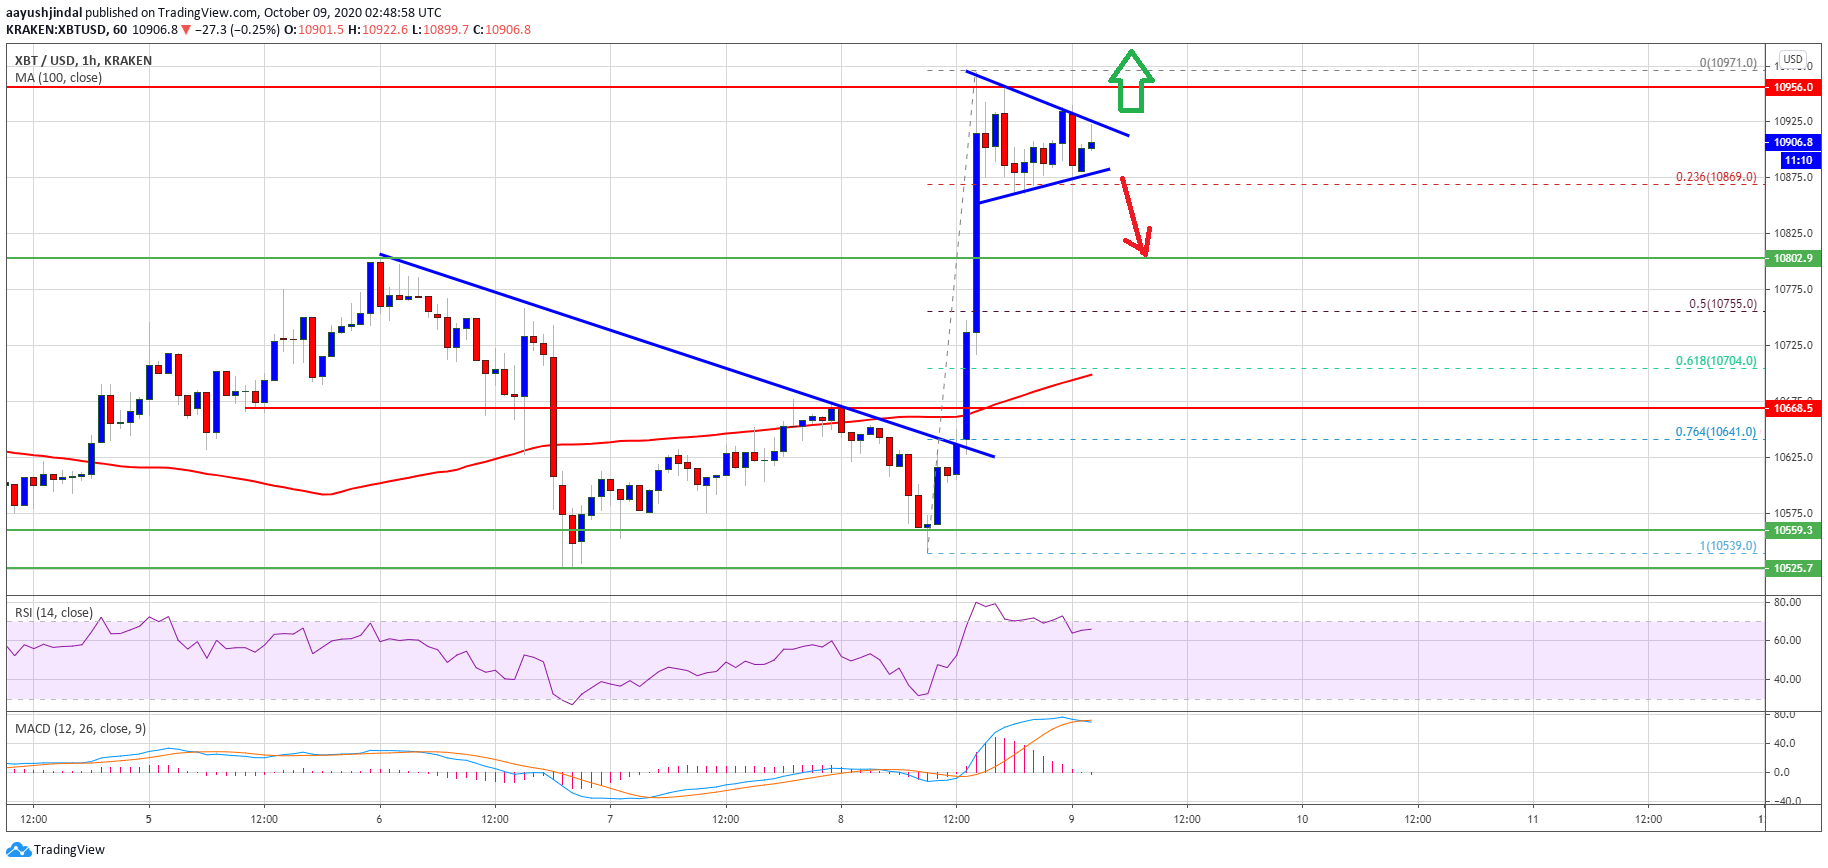
Bitcoin price recovers above $10,800. Source: TradingView.com
It seems like there is a contracting triangle forming with support near $10,880 on the same chart. The triangle support is close to the 23.6% Fib retracement level of the recent increase from the $10,539 low to $10,971 high.
On the upside, the first major resistance is near the $10,950 level. The main hurdle is still near the $11,000 level. A successful close above the $11,000 resistance could open the doors for a sustained upward move towards $11,500 in the near term.
Dips Now Supported in BTC?
The first key support for bitcoin is near the triangle trend line at $10,880. The next major support is near the $10,800 level or the 50% Fib retracement level of the recent increase from the $10,539 low to $10,971 high.
Any further losses could lead the price towards the $10,700 support level since it is close to the 100 hourly simple moving average.
Technical indicators:
Hourly MACD – The MACD is showing positive signs in the bullish zone.
Hourly RSI (Relative Strength Index) – The RSI for BTC/USD is currently well above the 60 level.
Major Support Levels – $10,880, followed by $10,800.
Major Resistance Levels – $10,950, $11,000 and $11,200.


