
Reason to trust
How Our News is Made
Strict editorial policy that focuses on accuracy, relevance, and impartiality
Ad discliamer
Morbi pretium leo et nisl aliquam mollis. Quisque arcu lorem, ultricies quis pellentesque nec, ullamcorper eu odio.
Bitcoin price surged towards the $18,500 level before correcting lower against the US Dollar. BTC must stay above $17,500 for upside continuation in the near term.
- Bitcoin rallied further towards the $18,500 level before correcting lower sharply.
- The price is holding the key $17,500 support and it is well above the 100 hourly simple moving average.
- There is a major contracting triangle forming with resistance near $18,020 on the hourly chart of the BTC/USD pair (data feed from Kraken).
- The pair could start a fresh rally if there is a proper close above $18,000 and $18,200.
Bitcoin Price Holding Key Supports
Yesterday, there was a sharp increase in bitcoin price above the $17,500 resistance level. BTC climbed over 10% and it even broke the $18,000 level. The price traded to a new multi-month high near $18,500 before it started a sharp decline.
The price crashed over $1,000 and it broke the $17,800 support. There was also a spike below the $17,500 support, but there was no close below it. The recent swing low was formed near $17,299 and the high was formed near $18,107.
The price is now consolidating gains below $18,000. There is also a major contracting triangle forming with resistance near $18,020 on the hourly chart of the BTC/USD pair. The pair is testing the 23.6% Fib retracement level of the recent wave from the $17,299 swing low to $18,107 high.
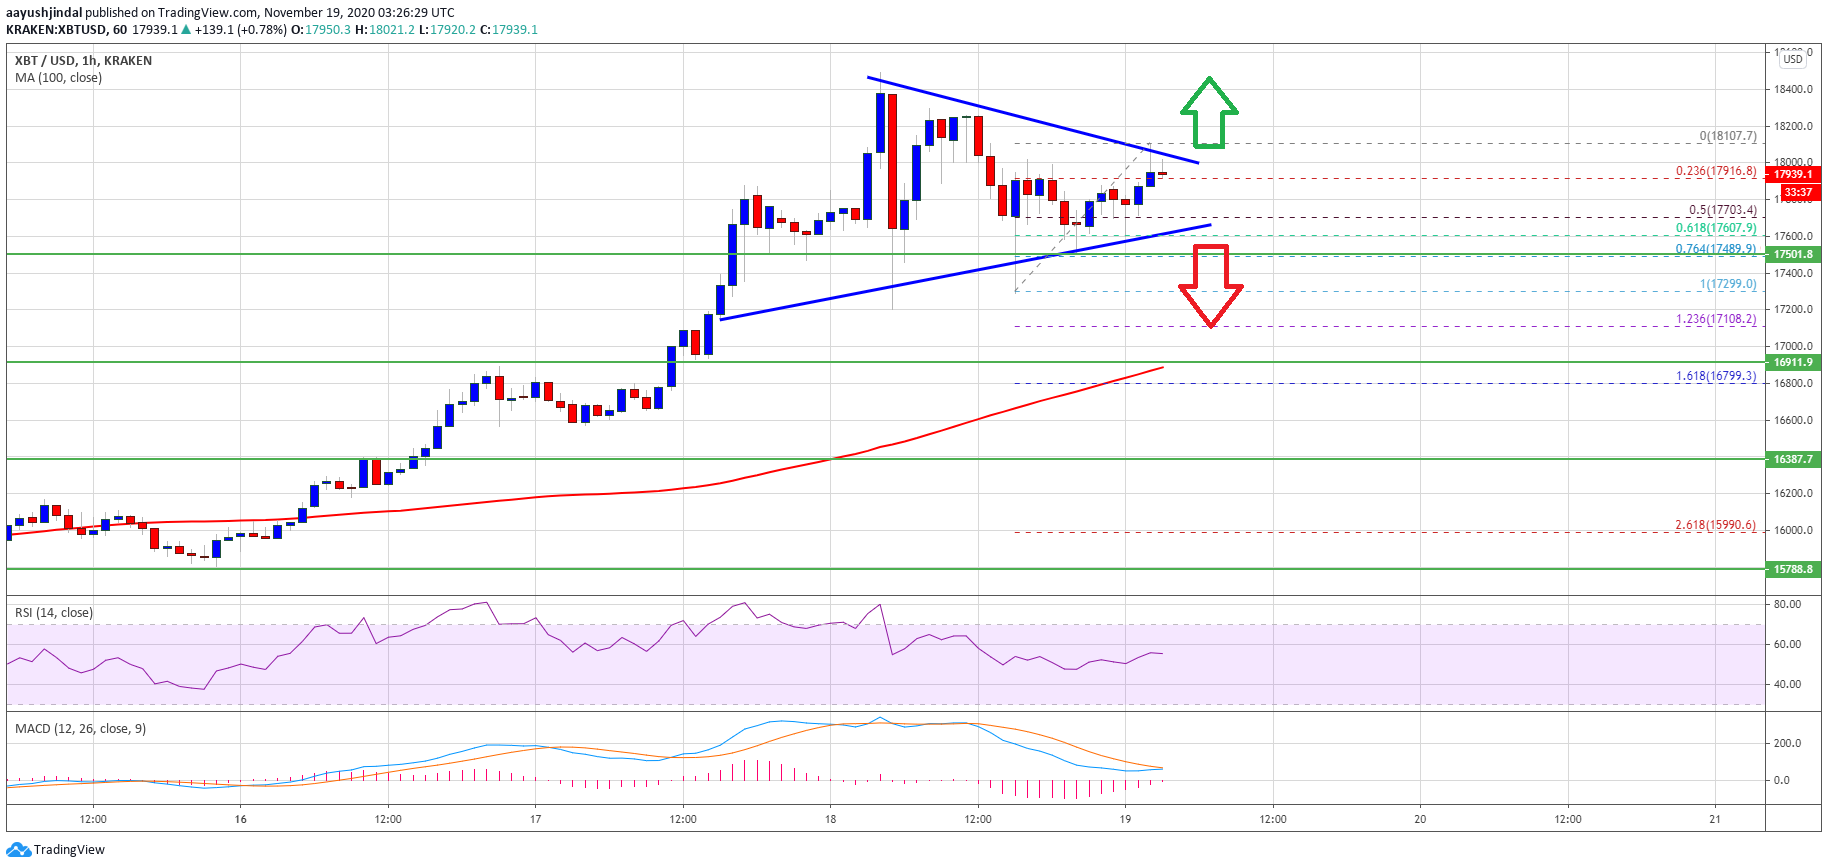
Source: BTCUSD on TradingView.com
The first major support seems to be forming near the $17,700 level and the triangle lower trend line. It is close to the 50% Fib retracement level of the recent wave from the $17,299 swing low to $18,107 high.
If there is a downside break below the triangle support, the price could test the $17,500 support. A proper close below the $17,500 support might start a strong decline in the coming days.
Fresh Rally in BTC?
If bitcoin clears the triangle resistance and then the $18,107 swing high, it could rally again. The next immediate hurdle is near the $18,200 level.
A proper follow through move above the $18,200 level is likely to open the doors for a larger increase. The next major resistance is near $18,500 and $18,880.
Technical indicators:
Hourly MACD – The MACD is slowly losing momentum in the bearish zone.
Hourly RSI (Relative Strength Index) – The RSI for BTC/USD is currently well above the 50 level.
Major Support Levels – $17,700, followed by $17,500.
Major Resistance Levels – $18,020, $18,200 and $18,500.


