
Reason to trust
How Our News is Made
Strict editorial policy that focuses on accuracy, relevance, and impartiality
Ad discliamer
Morbi pretium leo et nisl aliquam mollis. Quisque arcu lorem, ultricies quis pellentesque nec, ullamcorper eu odio.
Bitcoin price started a decent increase above the $46,000 resistance against the US Dollar. BTC is now back above $47,000, but it is facing hurdles near $47,600.
- Bitcoin started a steady increase above the $45,600 and $46,200 resistance levels.
- The price is now trading above $46,500 and the 100 hourly simple moving average.
- There was a break above a key bearish trend line with resistance near $46,000 on the hourly chart of the BTC/USD pair (data feed from Kraken).
- The pair must clear the $47,500 resistance zone to continue higher in the near term.
Bitcoin Price Starts Fresh Increase
Bitcoin price remained well bid above the $45,000 level. As a result, BTC started a fresh increase above the $46,000 resistance zone and the 100 hourly simple moving average.
The price broke the $46,200 and $46,500 resistance levels. There was also a break above a key bearish trend line with resistance near $46,000 on the hourly chart of the BTC/USD pair. The pair was able to climb above the $47,000 resistance zone.
It is now facing resistance near the $47,500 zone. A high is formed near $47,464 and bitcoin price is now consolidating gains. It is currently well above the 23.6% Fib retracement level of the upward move from the $43,374 swing low to $47,464 high.
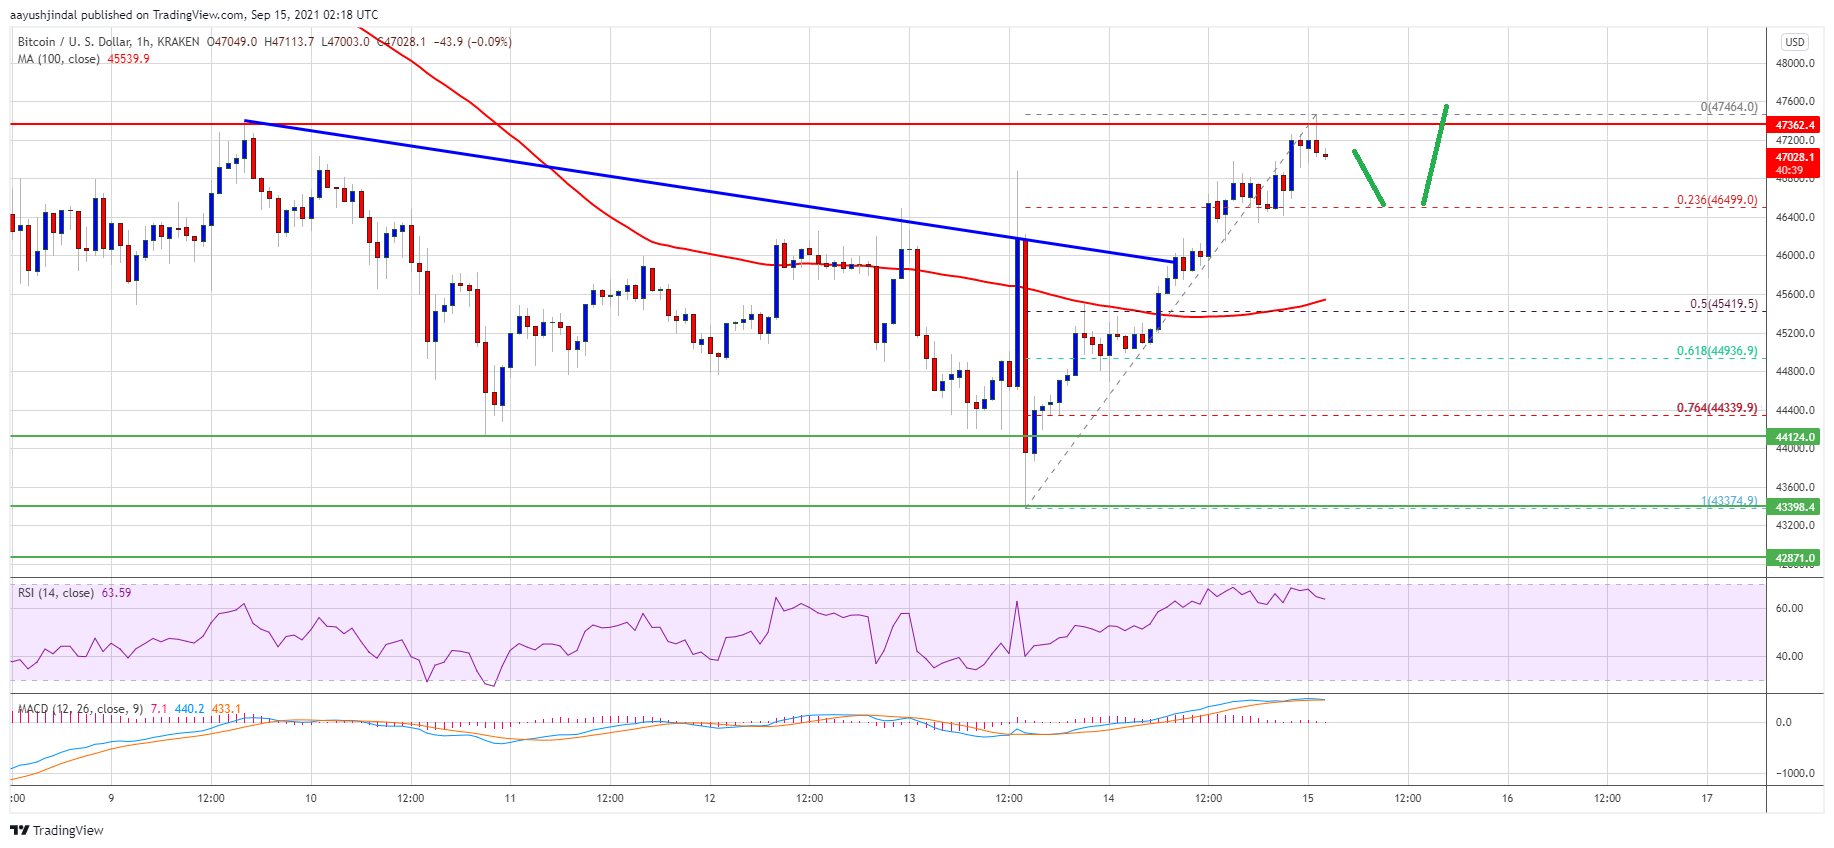
Source: BTCUSD on TradingView.com
An immediate resistance on the upside is near the $47,400 level. The main resistance is now near the $47,500 zone. To continue higher, bitcoin must clear the $47,500 resistance. The next major resistance is near the $48,000 level, above which the price could rise towards the key $50,000 resistance in the near term.
Dips Supported In BTC?
If bitcoin fails to clear the $47,500 resistance zone, it could start a downside correction. An immediate support on the downside is near the $46,500 level. The first major support is near the $46,000 level.
The next key support seems to be forming near the $45,400 level and the 100 hourly simple moving average. It is close to the 50% Fib retracement level of the upward move from the $43,374 swing low to $47,464 high.
Technical indicators:
Hourly MACD – The MACD is slowly losing pace in the bullish zone.
Hourly RSI (Relative Strength Index) – The RSI for BTC/USD is now well above the 50 level.
Major Support Levels – $46,500, followed by $45,400.
Major Resistance Levels – $47,500, $48,000 and $49,200.


