
Reason to trust
How Our News is Made
Strict editorial policy that focuses on accuracy, relevance, and impartiality
Ad discliamer
Morbi pretium leo et nisl aliquam mollis. Quisque arcu lorem, ultricies quis pellentesque nec, ullamcorper eu odio.
Bitcoin price failed to clear the key $36,000 resistance zone against the US Dollar. BTC is showing a few bearish signs and it could continue lower towards $30,000.
- Bitcoin failed to gain momentum above the 36,000 and $36,200 resistance levels.
- The price is now struggling below $35,000 and the 100 hourly simple moving average.
- There is a major bearish trend line forming with resistance near $34,600 on the hourly chart of the BTC/USD pair (data feed from Kraken).
- The pair could continue to move down towards $30,000 as long as it is below $35,000.
Bitcoin Price is Showing Bearish Signs
After trading as low as $30,312, bitcoin price started a fresh increase. BTC surpassed the $32,000 and $34,000 resistance levels to move into a positive zone.
The price even spiked above the $36,000 resistance. However, there was no close above $36,200 and $36,500 (a major hurdle as discussed yesterday). As a result, there was a rejection near $36,500 and the price declined below the $35,000 level.
There was a break below the $34,000 level and the 100 hourly simple moving average. The price even broke the 50% Fib retracement level of the upward move from the $30,312 low to $36,617 high.
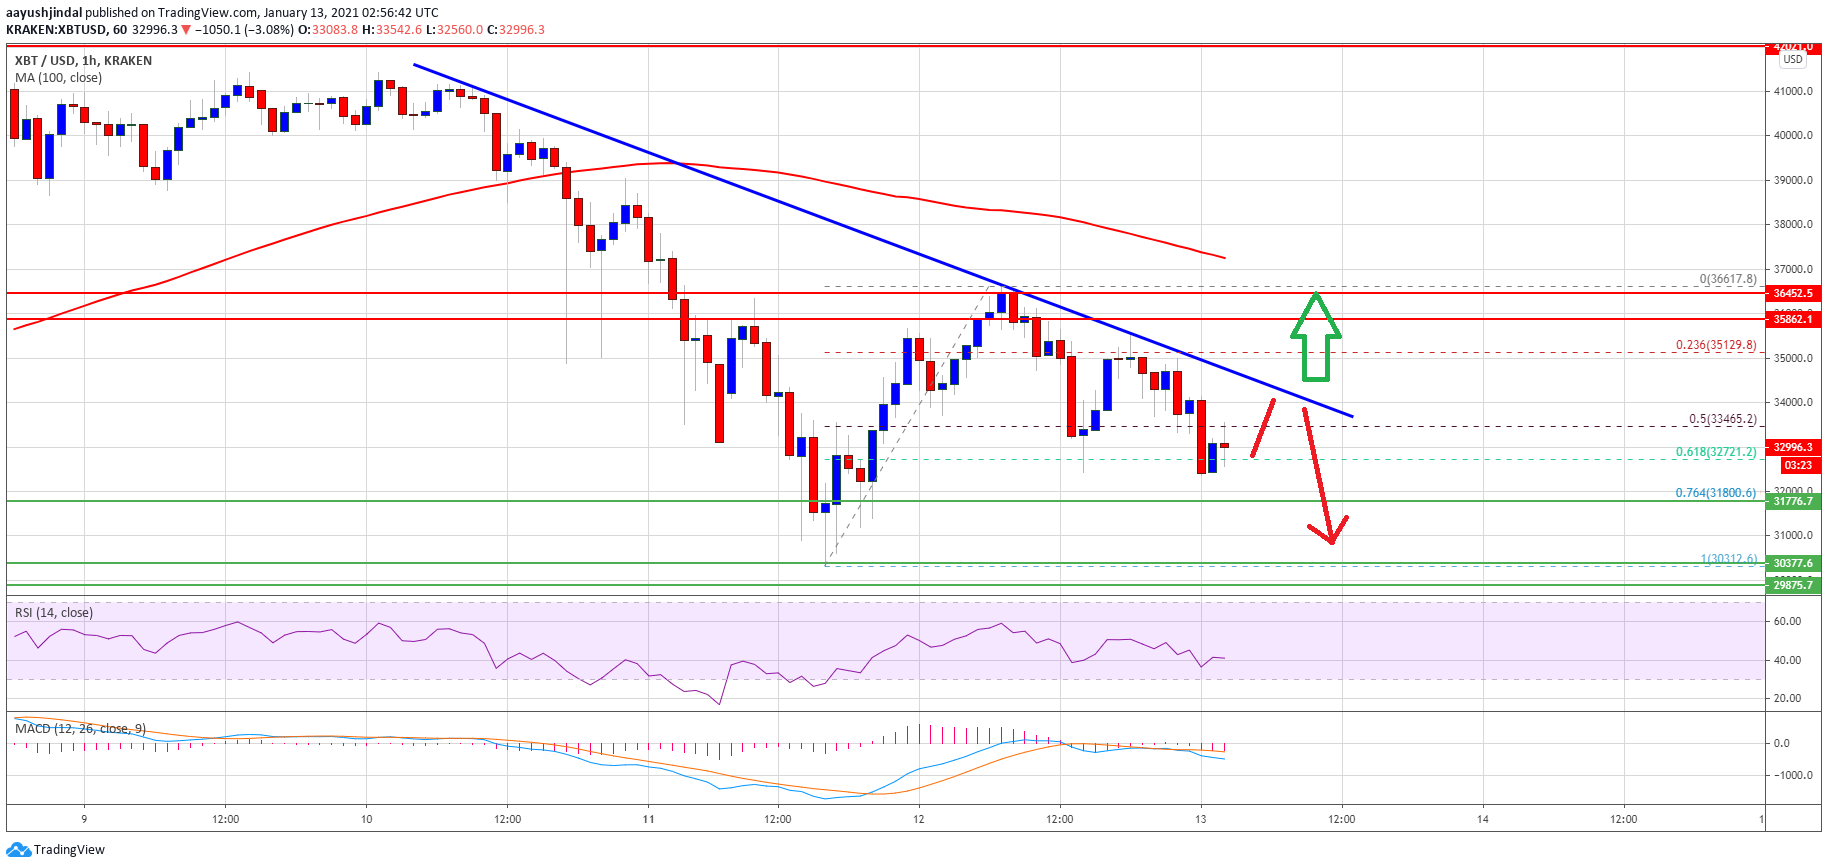
Source: BTCUSD on TradingView.com
There is also a major bearish trend line forming with resistance near $34,600 on the hourly chart of the BTC/USD pair. An initial support on the downside is near the $32,700 level. It is close to the 61.8% Fib retracement level of the upward move from the $30,312 low to $36,617 high.
The next major support is near the $31,700 level, below which bitcoin price might continue to move down towards the $30,500 and $30,000 levels. Any more losses could lead the price towards the $28,000 support zone.
Fresh Increase in BTC?
To move into a positive zone, bitcoin price needs to clear many hurdles, starting with $34,600. The first major resistance for the bulls is near the $35,000 level.
The main resistance is still near the $36,000, $36,200 and $36,500 levels. A close above $36,500 is likely to start a fresh rally towards $39,200 and $40,000 in the near term.
Technical indicators:
Hourly MACD – The MACD is slowly gaining momentum in the bearish zone.
Hourly RSI (Relative Strength Index) – The RSI for BTC/USD is recovering, but it is still below the 50 level.
Major Support Levels – $32,700, followed by $31,700.
Major Resistance Levels – $35,000, $36,000 and $36,500.


