
Reason to trust
How Our News is Made
Strict editorial policy that focuses on accuracy, relevance, and impartiality
Ad discliamer
Morbi pretium leo et nisl aliquam mollis. Quisque arcu lorem, ultricies quis pellentesque nec, ullamcorper eu odio.
Bitcoin price failed to stay above $50,000 and $49,000 against the US Dollar. BTC is now below the 100 hourly SMA and it is likely to continue lower towards $45,000
- Bitcoin started a fresh decline below the $50,000 and $49,000 support levels.
- The price is now trading well below $50,000 and the 100 hourly simple moving average.
- There is a connecting bearish trend line forming with resistance near $49,000 on the hourly chart of the BTC/USD pair (data feed from Kraken).
- The pair could extend its decline towards $45,000 as long as it is below $50,000.
Bitcoin Price Turns Red
After forming a short-term top near the $52,600 level, bitcoin started a fresh decline. BTC traded below the $51,200 and $50,000 support levels to move back into a negative zone.
There was also a break below a major bullish trend line with support near $49,500 on the hourly chart of the BTC/USD pair. The pair even broke the $48,000 support level. There was a clear break below the 50% Fib retracement level of the upward wave from the $43,050 swing low to $52,650 high.
It is now trading well below $50,000 and the 100 hourly simple moving average. It seems like the bulls are trying to protect the 61.8% Fib retracement level of the upward wave from the $43,050 swing low to $52,650 high.
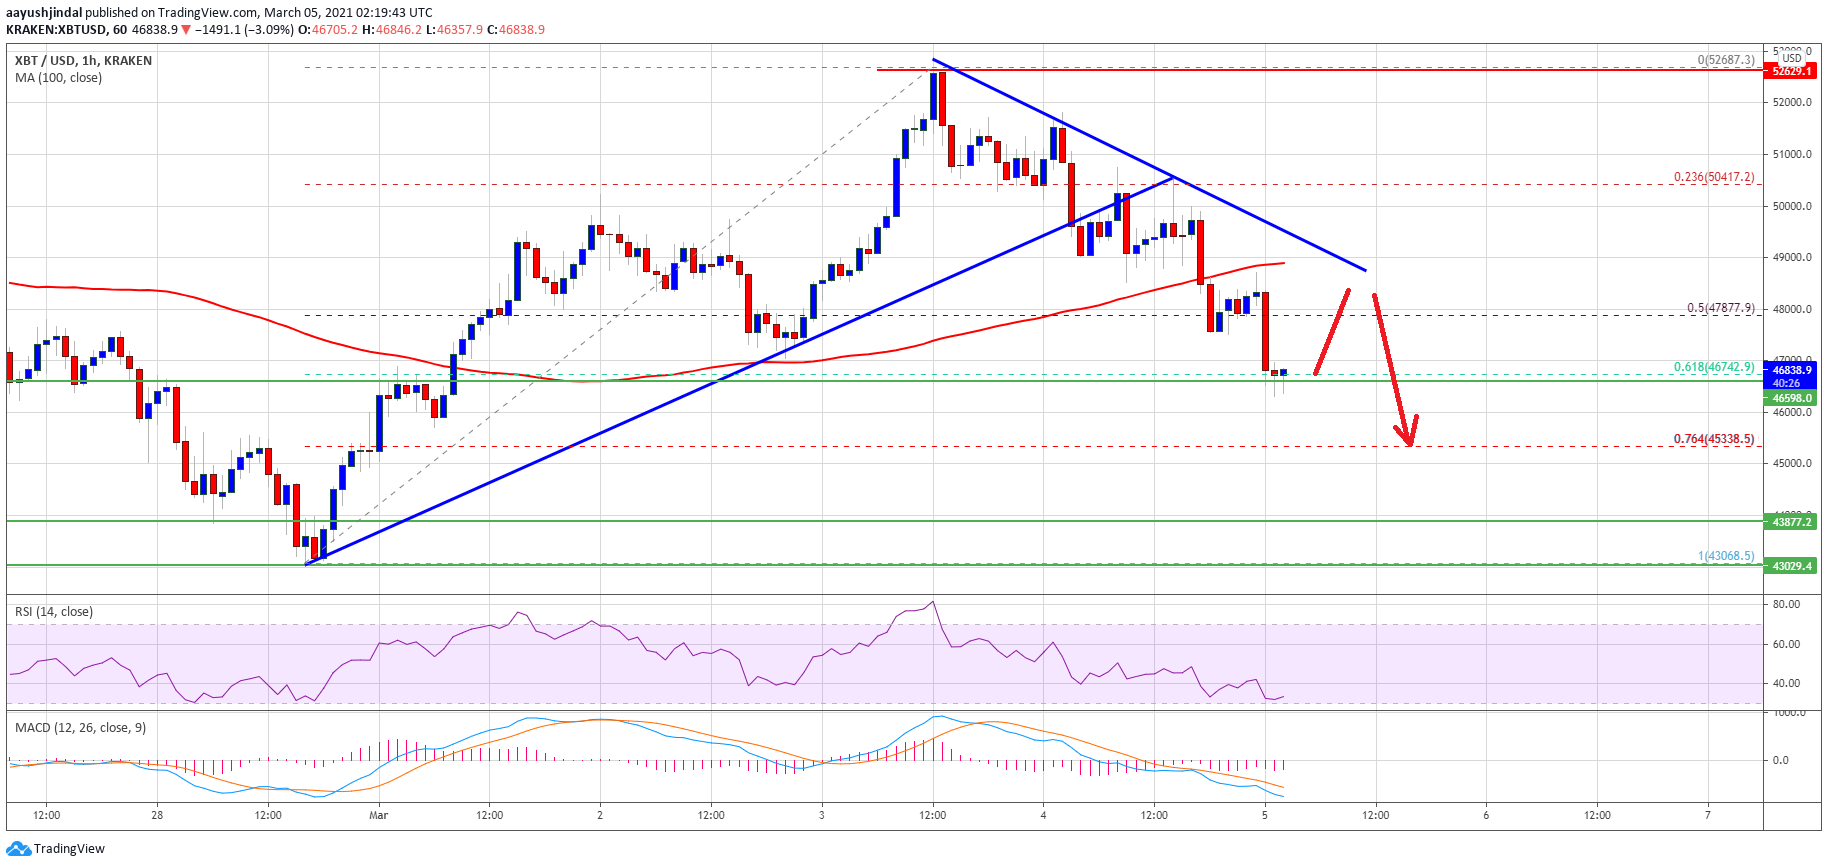
Source: BTCUSD on TradingView.com
If they fail and the price trades below $46,500, there are chances of more losses. The next key support is near the $45,000 level, below which the bears might aim a test of the $43,000 support zone.
Fresh Increase in BTC?
If bitcoin stays above $46,500, it could correct higher. An initial resistance on the upside is near the $48,000 level. The first major resistance is near the $49,000 level and the 100 hourly simple moving average.
There is also a connecting bearish trend line forming with resistance near $49,000 on the same chart. To move into a positive zone, the price must clear the trend line resistance and then gain pace above the $50,000 barrier.
Technical indicators:
Hourly MACD – The MACD is now gaining momentum in the bearish zone.
Hourly RSI (Relative Strength Index) – The RSI for BTC/USD is now well below the 50 level.
Major Support Levels – $46,500, followed by $45,000.
Major Resistance Levels – $48,000, $49,000 and $50,000.


