
Reason to trust
How Our News is Made
Strict editorial policy that focuses on accuracy, relevance, and impartiality
Ad discliamer
Morbi pretium leo et nisl aliquam mollis. Quisque arcu lorem, ultricies quis pellentesque nec, ullamcorper eu odio.
Cardano’s price surged above the main $0.1000 resistance level and started a strong increase. ADA is likely to continue higher towards $0.1250 in the coming days.
- ADA is showing positive signs and it is now trading well above $0.1000 against the US dollar.
- The price cleared the $0.1120 resistance and trading above the 100-day simple moving average.
- There was a break above a significant bearish trend line with resistance near $0.0965 on the daily chart of the ADA/USD pair (data source from Bitfinex).
- The pair is likely to continue higher towards the $0.1250 and $0.1280 resistance levels.
Cardano (ADA) is Gaining Bullish Momentum
This past month, cardano’s price started a fresh increase from the $0.0755 low. ADA cleared the $0.0880 and $0.0950 resistance levels to move into a positive zone.
The upward move gained pace after there was a break above a significant bearish trend line with resistance near $0.0965 on the daily chart of the ADA/USD pair. There was also a break above the 50% Fib retracement level of the key decline from the $0.1280 high to $0.0755 low.
Cardano cleared the $0.1120 resistance and trading above the 100-day simple moving average. An immediate resistance is near the $0.1155 level. It is close to the 76.4% Fib retracement level of the key decline from the $0.1280 high to $0.0755 low.
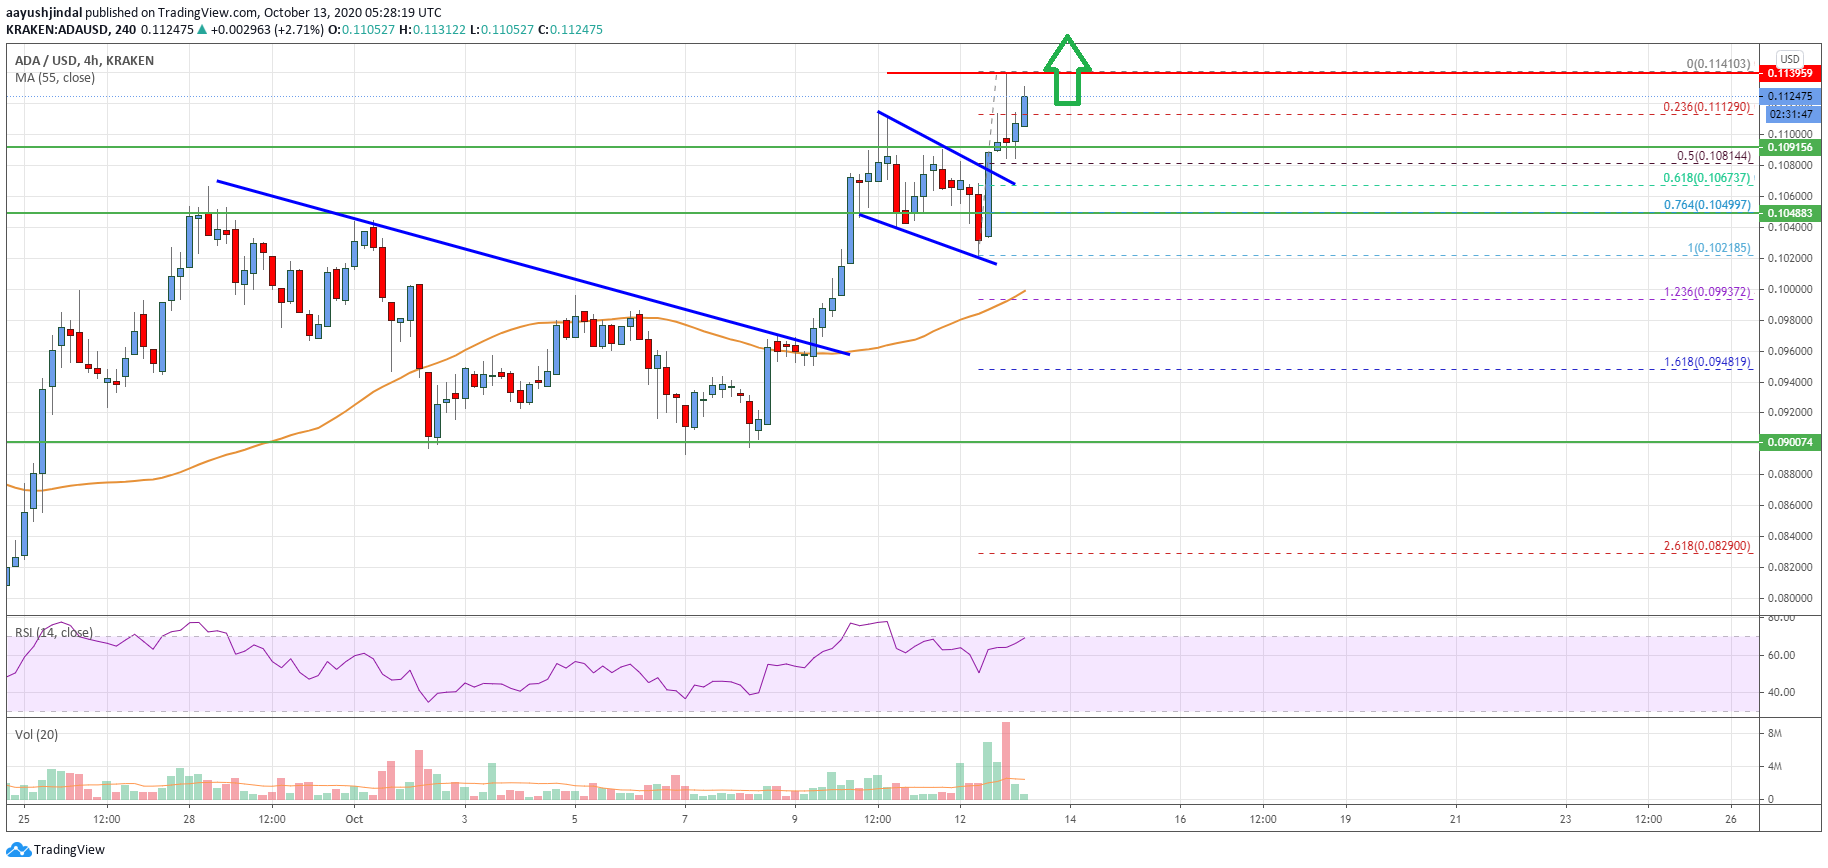
Cardano (ADA) price surging above $0.1100. Source: TradingView.com
A successful close above the $0.1155 level might clear the path for more upsides towards the $0.1250 resistance. The next key resistance is near $0.1280, above which the price may even test $0.1320.
Dips Supported?
If cardano’s price starts a downside correction, it is likely to find support near $0.1100. An initial support on the downside is near the $0.1080 level.
The main support is now forming near the $0.1020 level (a major breakout zone). If there is a downside break below $0.1020 and $0.1000, the price might start a strong decline.
Technical Indicators
Daily MACD – The MACD for ADA/USD is currently gaining pace in the bullish zone.
Daily RSI (Relative Strength Index) – The RSI for ADA/USD is currently well above the 50 level.
Major Support Levels – $0.1120, $0.1080 and $0.1020.
Major Resistance Levels – $0.1155, $0.1250 and $0.1280.


