
Reason to trust
How Our News is Made
Strict editorial policy that focuses on accuracy, relevance, and impartiality
Ad discliamer
Morbi pretium leo et nisl aliquam mollis. Quisque arcu lorem, ultricies quis pellentesque nec, ullamcorper eu odio.
Cardano’s price is declining from the $0.30 zone. ADA could continue to move down if it breaks the $0.280 support zone in the near term.
- ADA price is moving lower from the $0.302 zone against the US dollar.
- The price is trading below $0.290 and the 100 simple moving average (4 hours).
- There was a break below a key bullish trend line with support near $0.2960 on the 4-hour chart of the ADA/USD pair (data source from Kraken).
- The pair could slide further toward the $0.264 support zone.
Cardano’s ADA Price Corrects Gains
This past week, Cardano’s price started a decent recovery wave from the $0.264 support zone. The bulls managed to push the price above the $0.280 and $0.295 resistance levels.
It even spiked above the $0.300 resistance. A high is formed near $0.3013 and the price is now correcting gains, similar to Bitcoin and Ethereum. There was a move below the 50% Fib retracement level of the upward move from the $0.2675 swing low to the $0.3013 high.
Besides, there was a break below a key bullish trend line with support near $0.2960 on the 4-hour chart of the ADA/USD pair. The price is now trading below $0.290 and the 100 simple moving average (4 hours).
The price is now holding the $0.280 support. It is close to the 61.8% Fib retracement level of the upward move from the $0.2675 swing low to the $0.3013 high. On the upside, immediate resistance is near the $0.285 zone and the 100 simple moving average (4 hours).
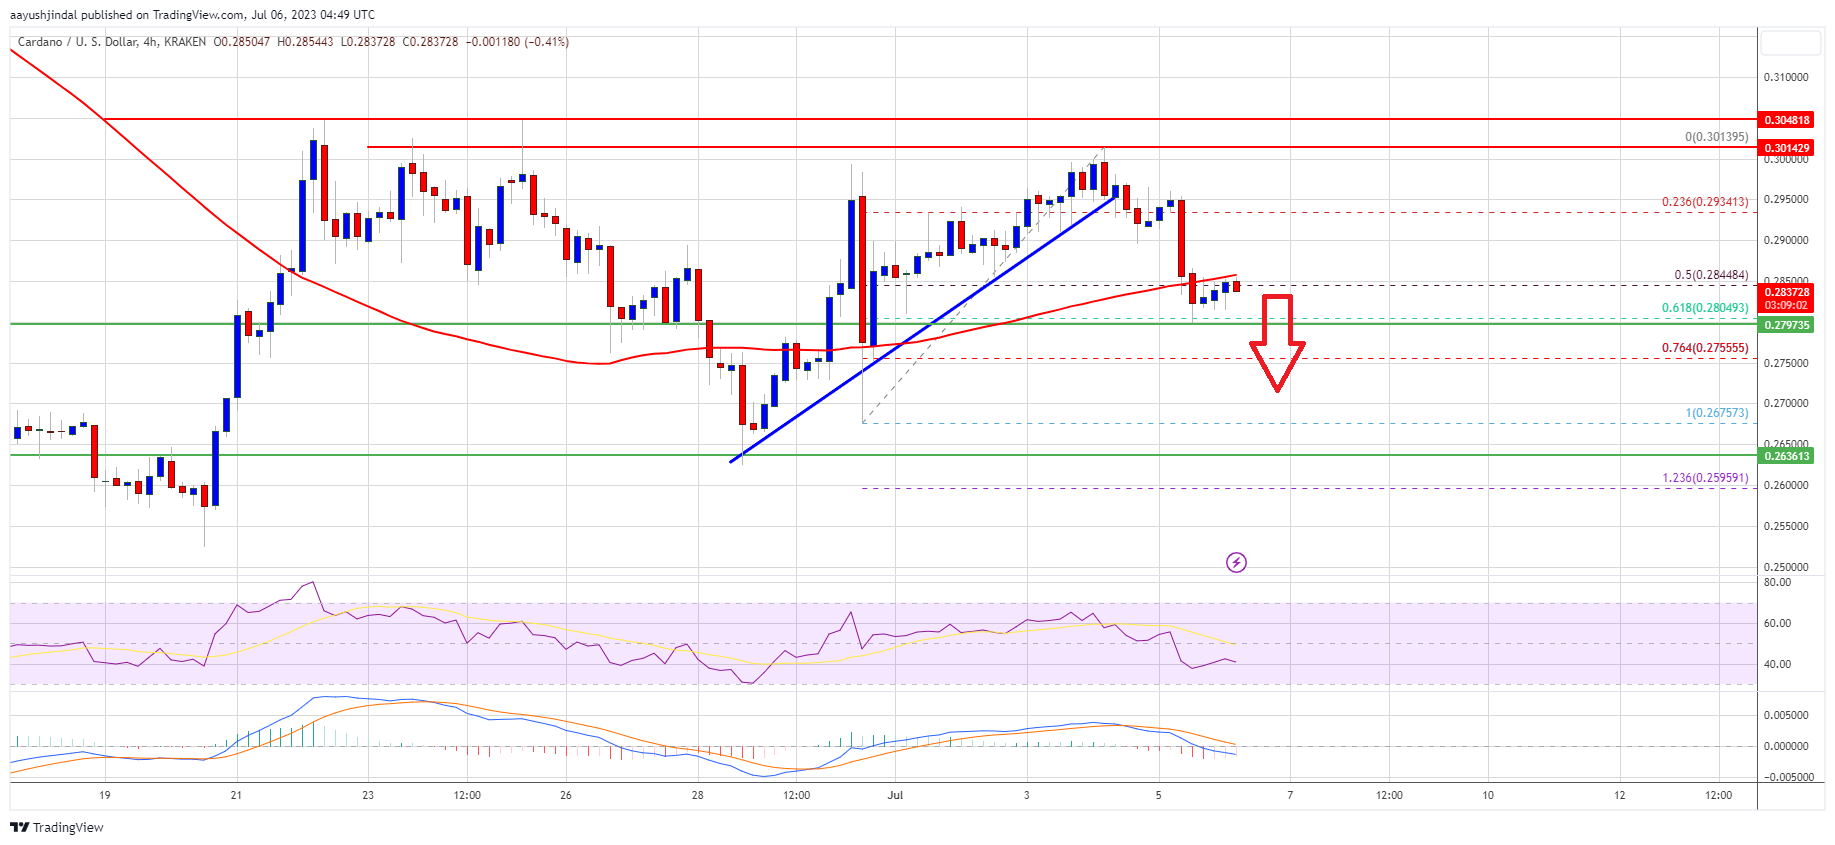
Source: ADAUSD on TradingView.com
The first major resistance is forming near the $0.292 zone. The next key resistance might be $0.30. If there is an upside break above the $0.300 and $0.305 resistance levels, the price could start a decent increase. In the stated case, the price could even surpass the $0.320 resistance zone.
More Losses in ADA?
If Cardano’s price fails to climb above the $0.285 resistance level, it could continue to move down. Immediate support on the downside is near the $0.280 level.
The next major support is near the $0.275 level. A downside break below the $0.275 level could open the doors for a fresh decline toward $0.262. The next major support is near the $0.250 level.
Technical Indicators
4 hours MACD – The MACD for ADA/USD is gaining momentum in the bearish zone.
4 hours RSI (Relative Strength Index) – The RSI for ADA/USD is now below the 50 level.
Major Support Levels – $0.280, $0.275, and $0.262.
Major Resistance Levels – $0.285, $0.295, and $0.305.


