
Reason to trust
How Our News is Made
Strict editorial policy that focuses on accuracy, relevance, and impartiality
Ad discliamer
Morbi pretium leo et nisl aliquam mollis. Quisque arcu lorem, ultricies quis pellentesque nec, ullamcorper eu odio.
Polkadot (DOT) is struggling below $5.00 against the US Dollar. The price must settle above the $4.35 and $4.50 resistance levels to start a decent increase.
- DOT declined steadily below the $5.50 and $5.00 levels against the US Dollar.
- The price is trading below the $5.00 zone and the 100-hourly simple moving average.
- There was a break above a connecting bearish trend line with resistance at $4.18 on the hourly chart of the DOT/USD pair (data source from Kraken).
- The pair could start a decent upward move if it settles above $4.35 and then $4.50.
Polkadot Price Remains In The Red Zone
In the past few weeks, DOT price saw a steady decline from well above $6.50. Bitcoin and Ethereum were stable, but Polkadot remained in the red zone. There was a close below the $5.00 level.
Finally, the price tested the $4.00 zone. A low was formed at $4.03 and the price recently started a recovery wave. There was a move above the $4.10 and $4.15 resistance levels. The price climbed above the 23.6% Fib retracement level of the downward move from the $4.65 swing high to the $4.03 low.
There was also a break above a connecting bearish trend line with resistance at $4.18 on the hourly chart of the DOT/USD pair. DOT is now trading below the $4.50 zone and the 100 simple moving average (4 hours).
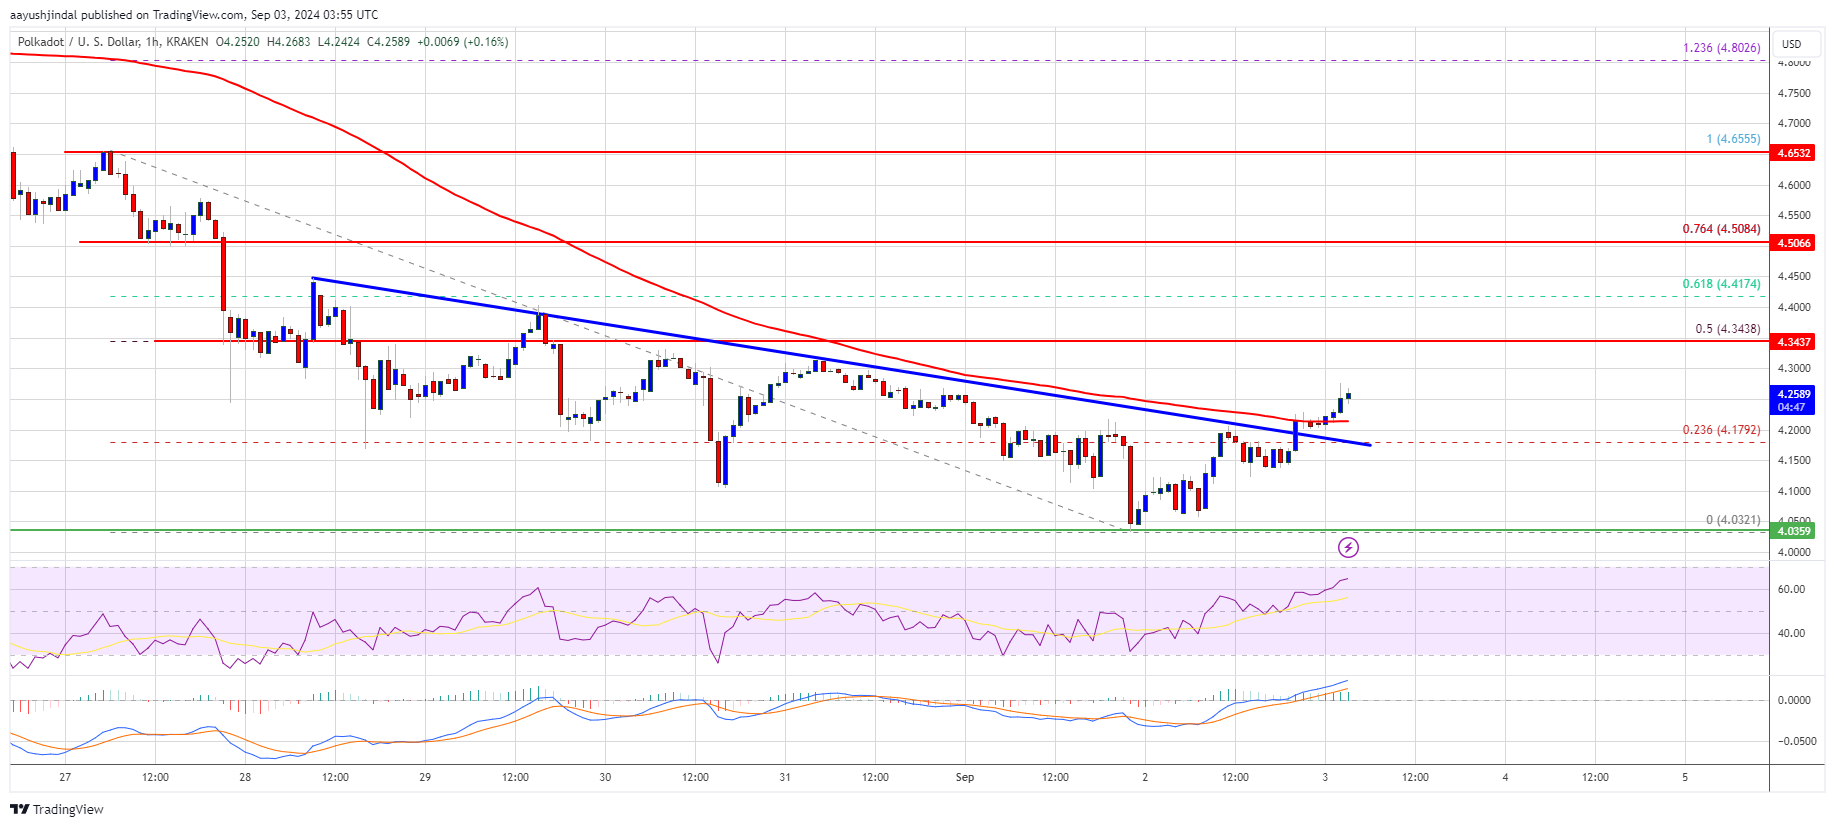
Immediate resistance is near the $4.30 level. The next major resistance is near $4.35 or the 50% Fib retracement level of the downward move from the $4.65 swing high to the $4.03 low. A successful break above $4.35 could start another strong rally. In the stated case, the price could easily rally toward $4.50 in the near term. The next major resistance is seen near the $5.00 zone.
Another Decline in DOT?
If DOT price fails to start a fresh increase above $4.35, it could start another decline. The first key support is near the $4.15 level.
The next major support is near the $4.10, below which the price might decline to $4.00. Any more losses may perhaps open the doors for a move toward the $3.85 support zone or $3.60.
Technical Indicators
Hourly MACD – The MACD for DOT/USD is now gaining momentum in the bullish zone.
Hourly RSI (Relative Strength Index) – The RSI for DOT/USD is now above the 50 level.
Major Support Levels – $4.15 and $4.00.
Major Resistance Levels – $4.35 and $4.50.


