Reason to trust
How Our News is Made
Strict editorial policy that focuses on accuracy, relevance, and impartiality
Ad discliamer
Morbi pretium leo et nisl aliquam mollis. Quisque arcu lorem, ultricies quis pellentesque nec, ullamcorper eu odio.
Bitcoin price is down over 2% and it faced another rejection below $11,000 against the US Dollar. BTC remains at a risk of more losses below $10,350 and $10,250.
- Bitcoin is failed again to clear the main $10,950 and $11,000 resistance levels.
- The price is down over 2%, and it is trading below the $10,700 level and the 100 hourly simple moving average.
- There was a break below a major bullish trend line with support at $10,690 on the hourly chart of the BTC/USD pair (data feed from Kraken).
- The pair is currently correcting losses, but it could resume its decline below $10,500.
Bitcoin Price Turns Red
Yesterday, we saw a steady increase in bitcoin price above the $10,800 level against the US Dollar. BTC price even climbed above the $10,900 level and the 100 hourly simple moving average.
However, the bulls failed to gain strength and there was no upside break above $11,000. As a result, there was a fresh bearish reaction and the price declined sharply below the $10,800 support.
There was also a break below a major bullish trend line with support at $10,690 on the hourly chart of the BTC/USD pair. The pair declined below the $10,500 level and settled well below the 100 hourly simple moving average.
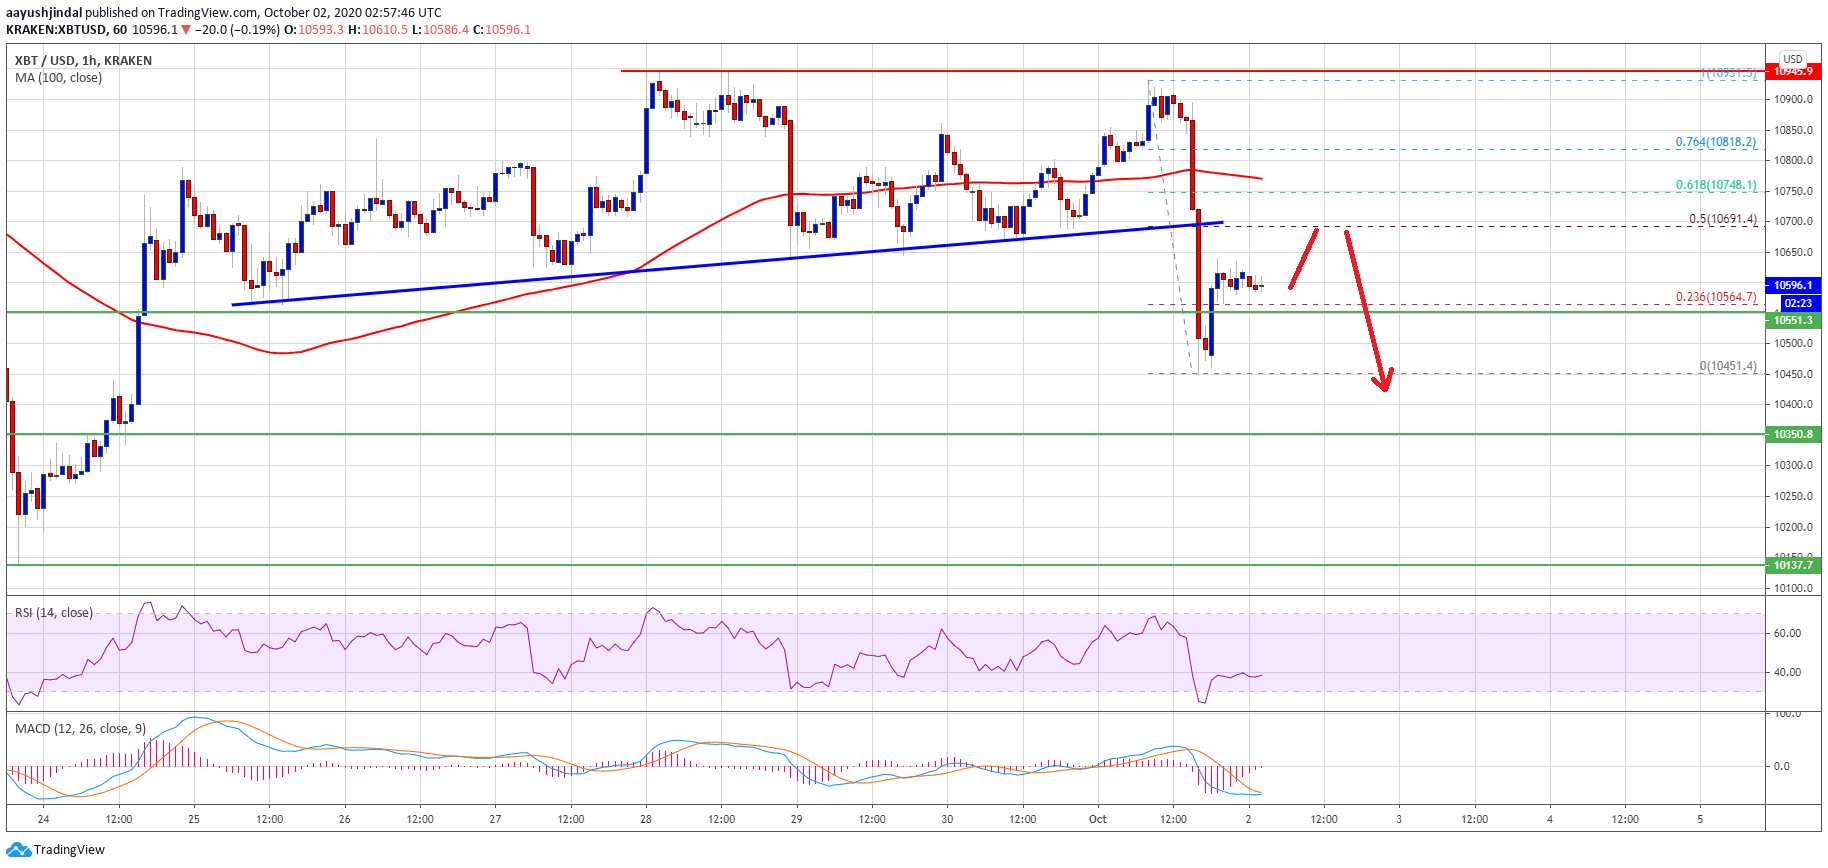
Bitcoin price dives below $10,800. Source: TradingView.com
A low is formed near $10,451 and the price is currently correcting higher. It broke the $10,550 level, plus the 23.6% Fib retracement level of the recent decline from the $10,931 high to $10,451 low.
The first key resistance on the upside is near the broken trend line at $10,700. It is close to the 50% Fib retracement level of the recent decline from the $10,931 high to $10,451 low. The next key resistance is near the $10,800 level, above which the bulls might attempt another upside break at $11,000.
More Losses in BTC?
If bitcoin fails to recover above the $10,650 and $10,700 levels, there are high chances of more downsides in the near term. An initial support is near the $10,451 low.
The first major support is near the $10,350 level, below which the price could slide towards the main support at $10,250. Any further losses may perhaps call for a test of $10,000.
Technical indicators:
Hourly MACD – The MACD is showing a few signs of recovery in the bearish zone.
Hourly RSI (Relative Strength Index) – The RSI for BTC/USD is currently near the 40 level.
Major Support Levels – $10,450, followed by $10,250.
Major Resistance Levels – $10,700, $10,800 and $11,000.


