
Reason to trust
How Our News is Made
Strict editorial policy that focuses on accuracy, relevance, and impartiality
Ad discliamer
Morbi pretium leo et nisl aliquam mollis. Quisque arcu lorem, ultricies quis pellentesque nec, ullamcorper eu odio.
Ethereum is down over 8% and it broke many key supports near $355 against the US Dollar. ETH price is currently consolidating losses and it is likely to face hurdles near $355 or $362.
- Ethereum started a sharp decline from the $375 resistance and broke the $355 support.
- The price is finding bids above $330, but it is now well below the 100 hourly simple moving average.
- There is a short-term breakout pattern forming with resistance near $348 on the hourly chart of ETH/USD (data feed via Kraken).
- The pair is likely to face a strong resistance near the $355 zone (support turned resistance).
Ethereum Price Turns Red
Yesterday, we discussed the chances of a fresh decline in Ethereum if it fails to clear $375 and $380. ETH price struggled to clear the $375 resistance zone, resulting in a sharp bearish reaction.
The decline was initiated after there was a break below key declining channel with support at $365 on the hourly chart of ETH/USD. Ether price accelerated its decline below the main $355 support level and the 100 hourly simple moving average.
It is down over 8% and a new weekly low is formed near $331. Ethereum is currently correcting higher and trading above the $340 level. There was a break above the 23.6% Fib retracement level of the recent decline from the $375 high to $331 low.
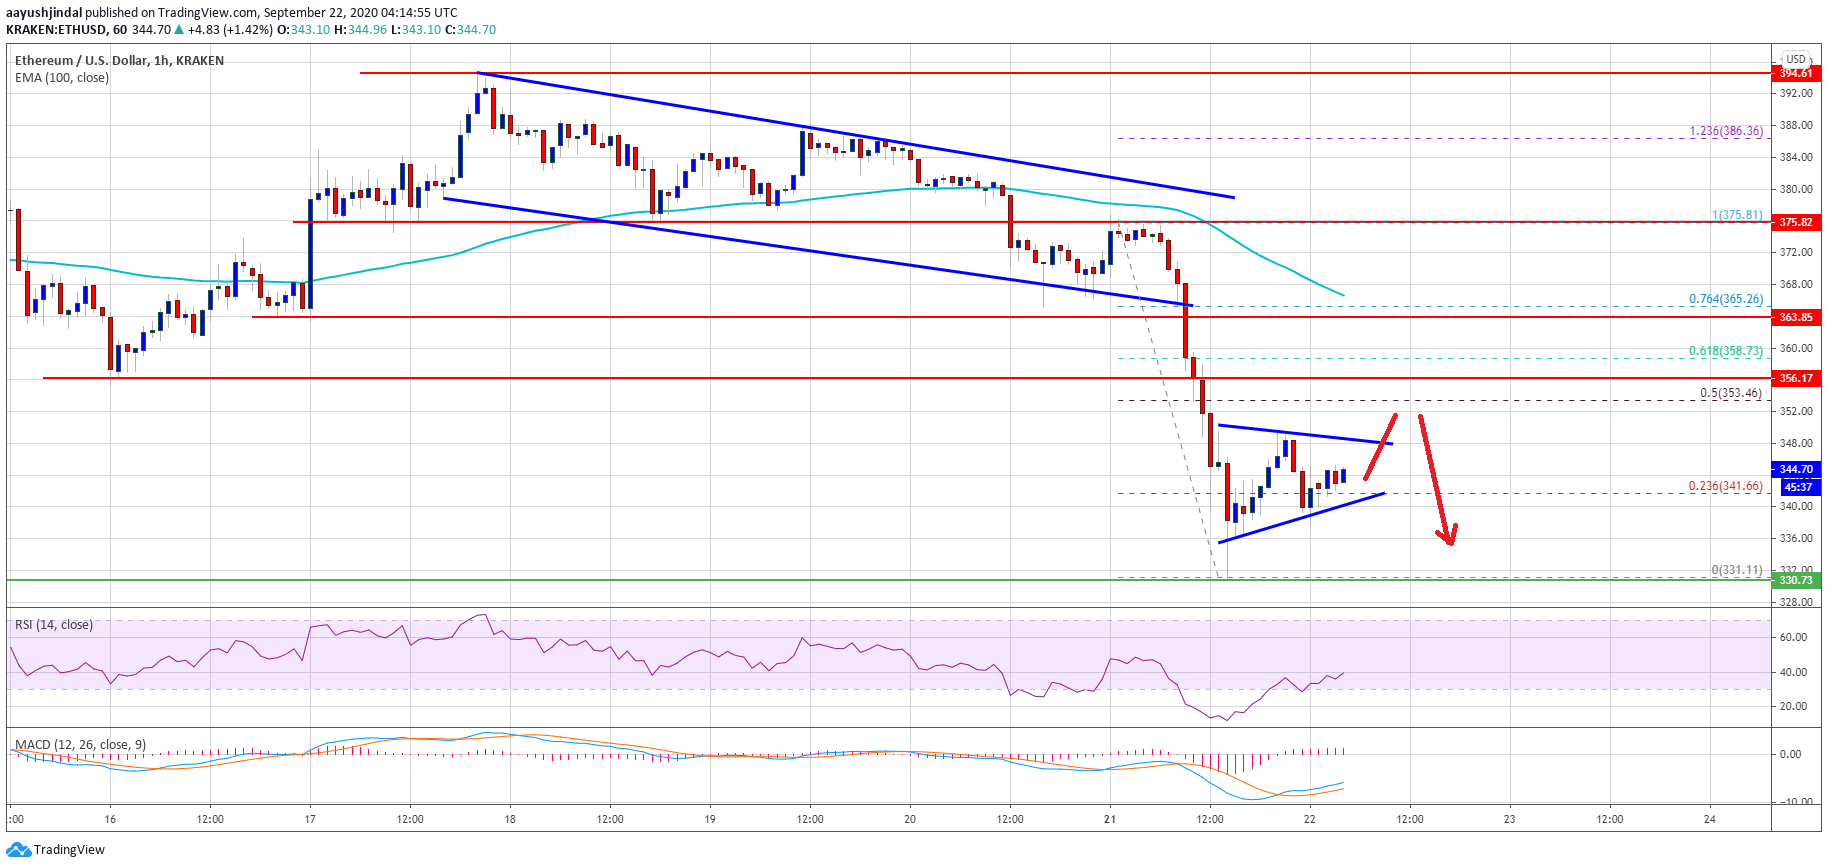
Ethereum price dives below $355. Source: TradingView.com
It seems like there is a short-term breakout pattern forming with resistance near $348 on the same chart. If there is an upside correction above the $348 level, ether could face a strong selling interest near the $355 zone (support turned resistance).
The 50% Fib retracement level of the recent decline from the $375 high to $331 low is also near $353 to act as a resistance. The next major hurdle is seen near the $365 level or the 100 hourly SMA.
More Losses in ETH?
If Ethereum fails to recover above the triangle resistance of the $355 hurdle, there is a risk of more losses. An initial support is near the triangle support at $341.
A downside break below the triangle support could lead the price back towards the $330 swing low. The next major support for the bulls is near the $320 level, below which it could retest the $310 level.
Technical Indicators
Hourly MACD – The MACD for ETH/USD is slowly moving in the bullish zone.
Hourly RSI – The RSI for ETH/USD is correcting higher towards the 50 level.
Major Support Level – $330
Major Resistance Level – $355


