
Reason to trust
How Our News is Made
Strict editorial policy that focuses on accuracy, relevance, and impartiality
Ad discliamer
Morbi pretium leo et nisl aliquam mollis. Quisque arcu lorem, ultricies quis pellentesque nec, ullamcorper eu odio.
Ethereum rallied more than 5% and it broke the key $370 resistance against the US Dollar. ETH price is struggling to clear the $390 resistance and it is currently correcting lower.
- Ethereum started a strong increase after forming a key double bottom pattern near $355.
- The price is up over 5% and it surpassed the $370 barrier and the 100 hourly simple moving average.
- There was a break above a major bearish trend line with resistance near $372 on the hourly chart of ETH/USD (data feed via Kraken).
- The pair is likely to remain well supported near the $370 support and the 100 hourly SMA.
Ethereum Price Turns Green
Yesterday, we discussed a possible double bottom pattern for Ethereum near $355. ETH price did follow a bullish path and broke a couple of important resistances near the $370 level.
There was also a close above the $370 level and the 100 hourly simple moving average. More importantly, there was a break above a major bearish trend line with resistance near $372 on the hourly chart of ETH/USD.
Ether price is up over 5% and it tested the next important resistance near the $385 zone. A high is formed near $385 and the price is currently correcting lower. It broke the $380 level and the 23.6% Fib retracement level of the upward move from the $355 low to $385 high.
On the downside, the price is likely to find a strong support near the broken trend line and $370. The 50% Fib retracement level of the upward move from the $355 low to $385 high is also active near $370 along with the 100 hourly simple moving average.
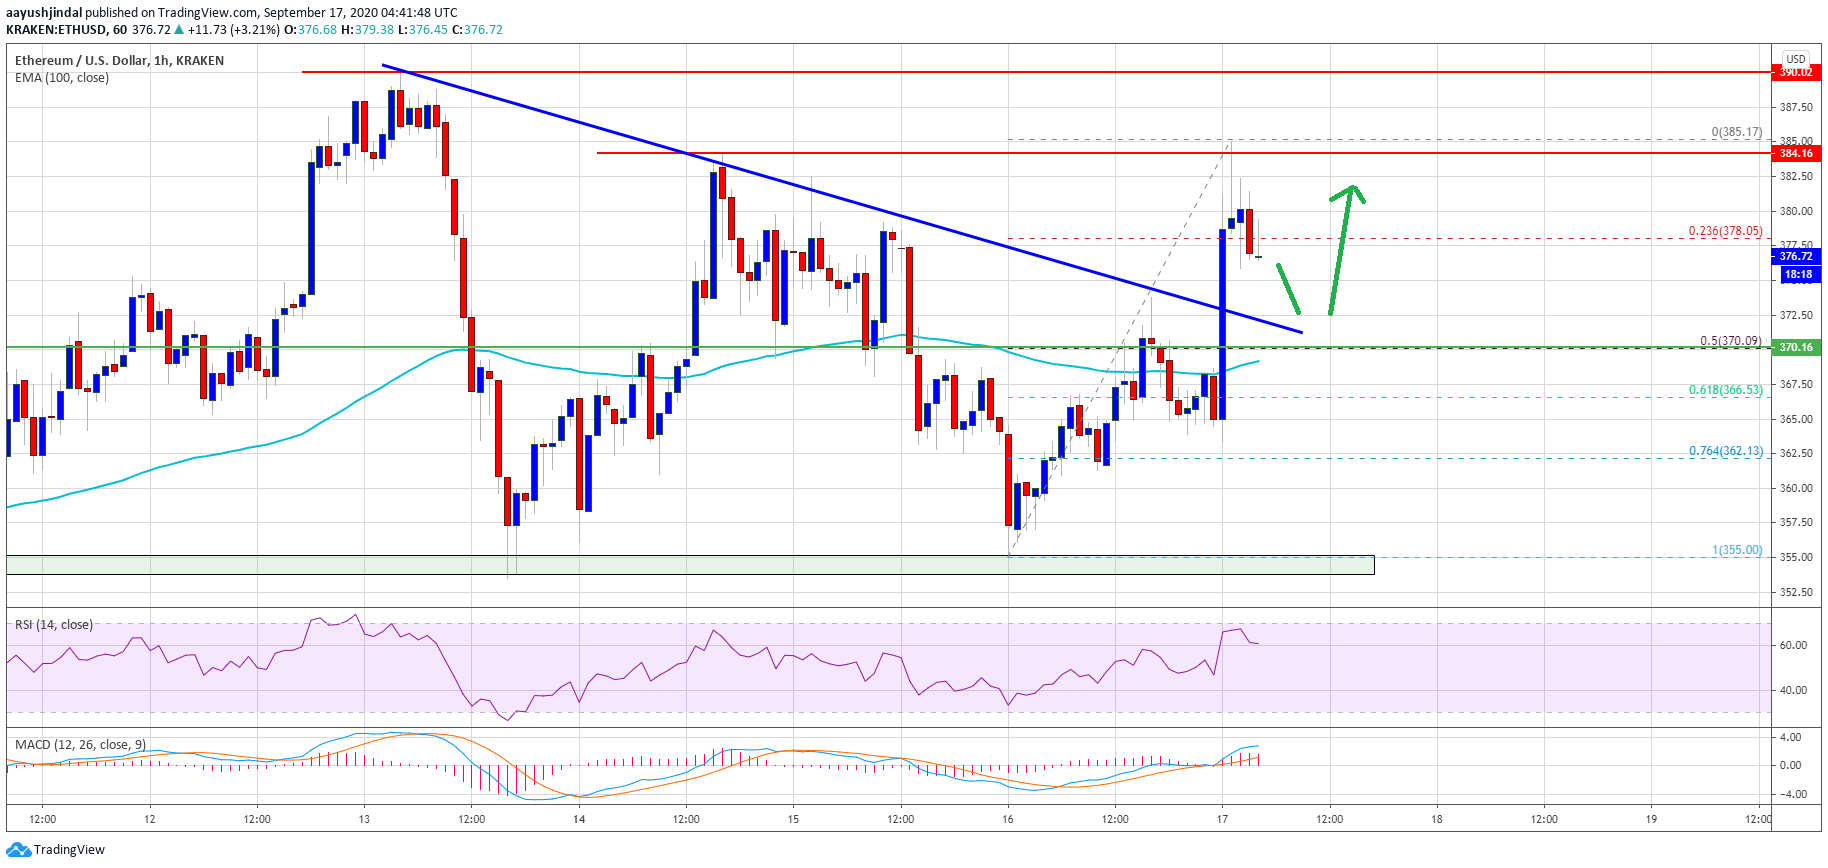
Ethereum price trades above $370. Source: TradingView.com
If ether stays above the $370 support and the 100 hourly simple moving average, there are chances of a fresh increase. An initial resistance is near the $385 level. The first major resistance is near the $390 level.
A successful close above the $390 resistance might start a steady rise towards the $400 barrier. Any further gains could lead the price towards the $420 resistance in the near term.
Fresh Decline in ETH?
If Ethereum fails to clear the $385 and $390 resistance levels, there is a risk of a downside break. The main support is near the $370 level and the 100 hourly SMA.
A proper break below the $370 support zone could put a lot of pressure on the bulls and the price might decline towards the next major support at $355.
Technical Indicators
Hourly MACD – The MACD for ETH/USD is slowly losing pace in the bullish zone.
Hourly RSI – The RSI for ETH/USD is currently well above the 60 level.
Major Support Level – $370
Major Resistance Level – $390


