
Reason to trust
How Our News is Made
Strict editorial policy that focuses on accuracy, relevance, and impartiality
Ad discliamer
Morbi pretium leo et nisl aliquam mollis. Quisque arcu lorem, ultricies quis pellentesque nec, ullamcorper eu odio.
Tron price rallied over 15% and it surpassed the key $0.0220 resistance zone against the US Dollar. TRX could correct lower in the short term, but the price action suggests more gains.
- Tron price is gaining bullish momentum above the $0.0220 resistance against the US dollar.
- The price traded to a new weekly high at $0.0243 and it is currently correcting lower.
- There is a crucial bullish trend line forming with support near $0.0210 on the 4-hours chart of the TRX/USD pair (data source from Bitfinex).
- The pair is likely to continue higher towards $0.0250 or even $0.0265 as long as it is above $0.0218.
Tron Price Starts Fresh Increase
After forming a strong support base above $0.0200, tron price started a fresh increase against the US Dollar. TRX broke a couple of important resistances near $0.0218 to move into a positive zone.
The upward move gained strength above the $0.0220 level and the 100 simple moving average (4-hours). It jumped over 15% and traded to a new weekly high at $0.0243. At the moment, the price is consolidating gains and trading near the $0.0232 level.
An initial support is near the $0.0230 level. It is close to the 23.6% Fib retracement level of the recent rally from the $0.0190 low to $0.0243 high. The first major support on the downside is near the $0.0220 and $0.0218 levels.
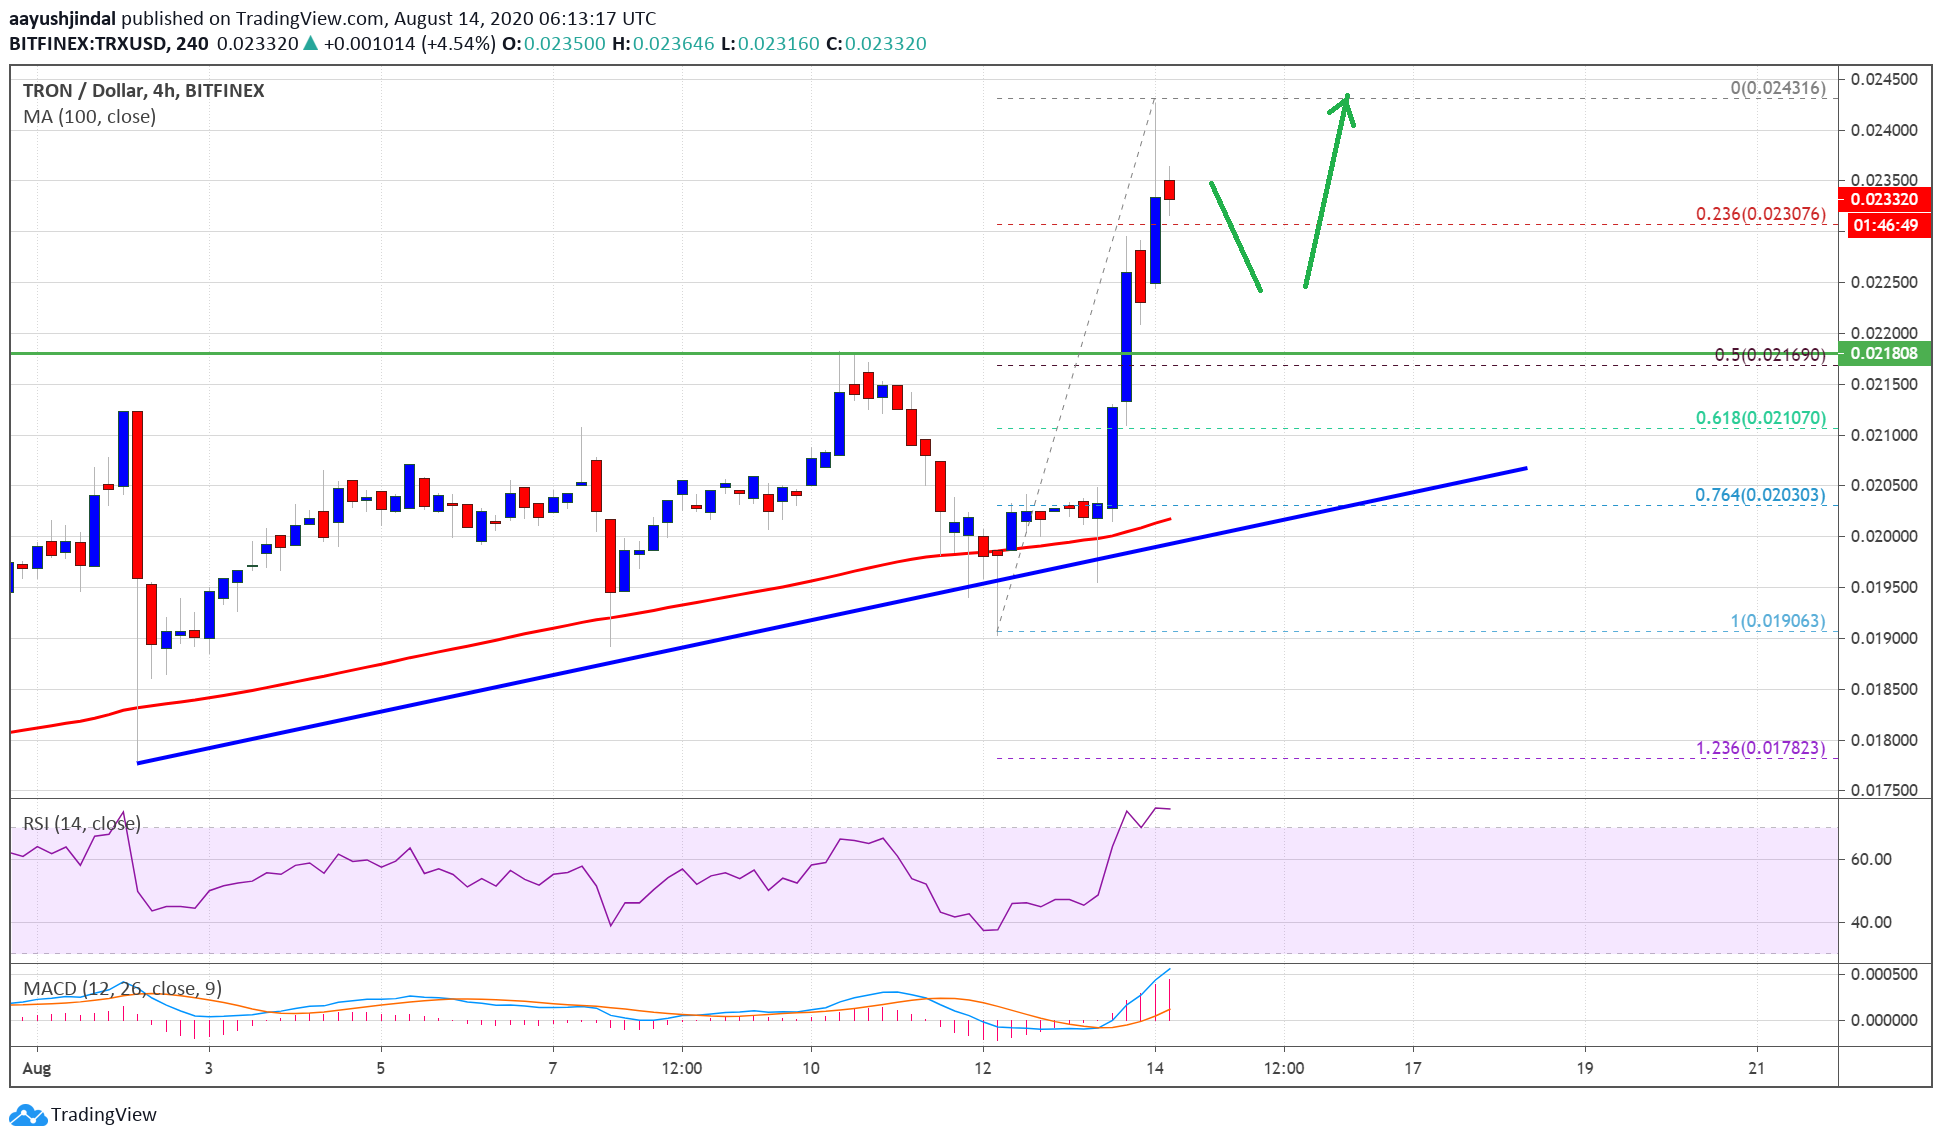
Tron (TRX) price breaks $0.024. Source: TradingView.com
The 50% Fib retracement level of the recent rally from the $0.0190 low to $0.0243 high is also near the $0.0216 level to act as a strong support. On the upside, the $0.0240 level is an immediate hurdle for the bulls. A successful close above the $0.0240 resistance level could open the doors for a larger rally towards the $0.0250 level or even $0.0265 in the coming sessions.
Dips Likely to be Limited in TRX
If TRX price corrects lower, it is likely to remain supported near the $0.0200 pivot level. The next major support is near the $0.0218 level (the recent breakout zone).
There is also a crucial bullish trend line forming with support near $0.0210 on the 4-hours chart of the TRX/USD pair. Any further losses may perhaps push the price back towards the $0.0200 support.
Technical Indicators
4-hours MACD – The MACD for TRX/USD is gaining momentum in the bullish zone.
4-hours RSI (Relative Strength Index) – The RSI for TRX/USD is rising and it is well above the 70 level.
Major Support Levels – $0.0230, $0.0220 and $0.0218.
Major Resistance Levels – $0.0240, $0.0250 and $0.0265.


