
Reason to trust
How Our News is Made
Strict editorial policy that focuses on accuracy, relevance, and impartiality
Ad discliamer
Morbi pretium leo et nisl aliquam mollis. Quisque arcu lorem, ultricies quis pellentesque nec, ullamcorper eu odio.
Ripple is currently consolidating above the $0.1720 support against the US Dollar. XRP price seems to be preparing for a bullish break above the $0.1800 resistance region.
- Ripple price is facing a couple of important hurdles near the $0.1780 and $0.1800 levels against the US dollar.
- The price is trading well below the 100 simple moving average (4-hours) and $0.1900.
- There is a crucial bearish trend line forming with resistance near $0.1780 on the 4-hours chart of the XRP/USD pair (data source from Kraken).
- The pair is likely to start a fresh increase if it clears the $0.1780 and $0.1800 resistance levels.
Ripple Price Approaching Next Break
After diving below $0.1700, ripple started a slow and steady recovery. XRP price traded above the $0.1700 and $0.1720 levels to move into a short-term positive zone.
There was a break above the 23.6% Fib retracement level of the downward move from the $0.1868 high to $0.1689 low. However, the price is facing a couple of important hurdles near the $0.1780 and $0.1800 levels.
There is also a crucial bearish trend line forming with resistance near $0.1780 on the 4-hours chart of the XRP/USD pair. The trend line is close to the 50% Fib retracement level of the downward move from the $0.1868 high to $0.1689 low.
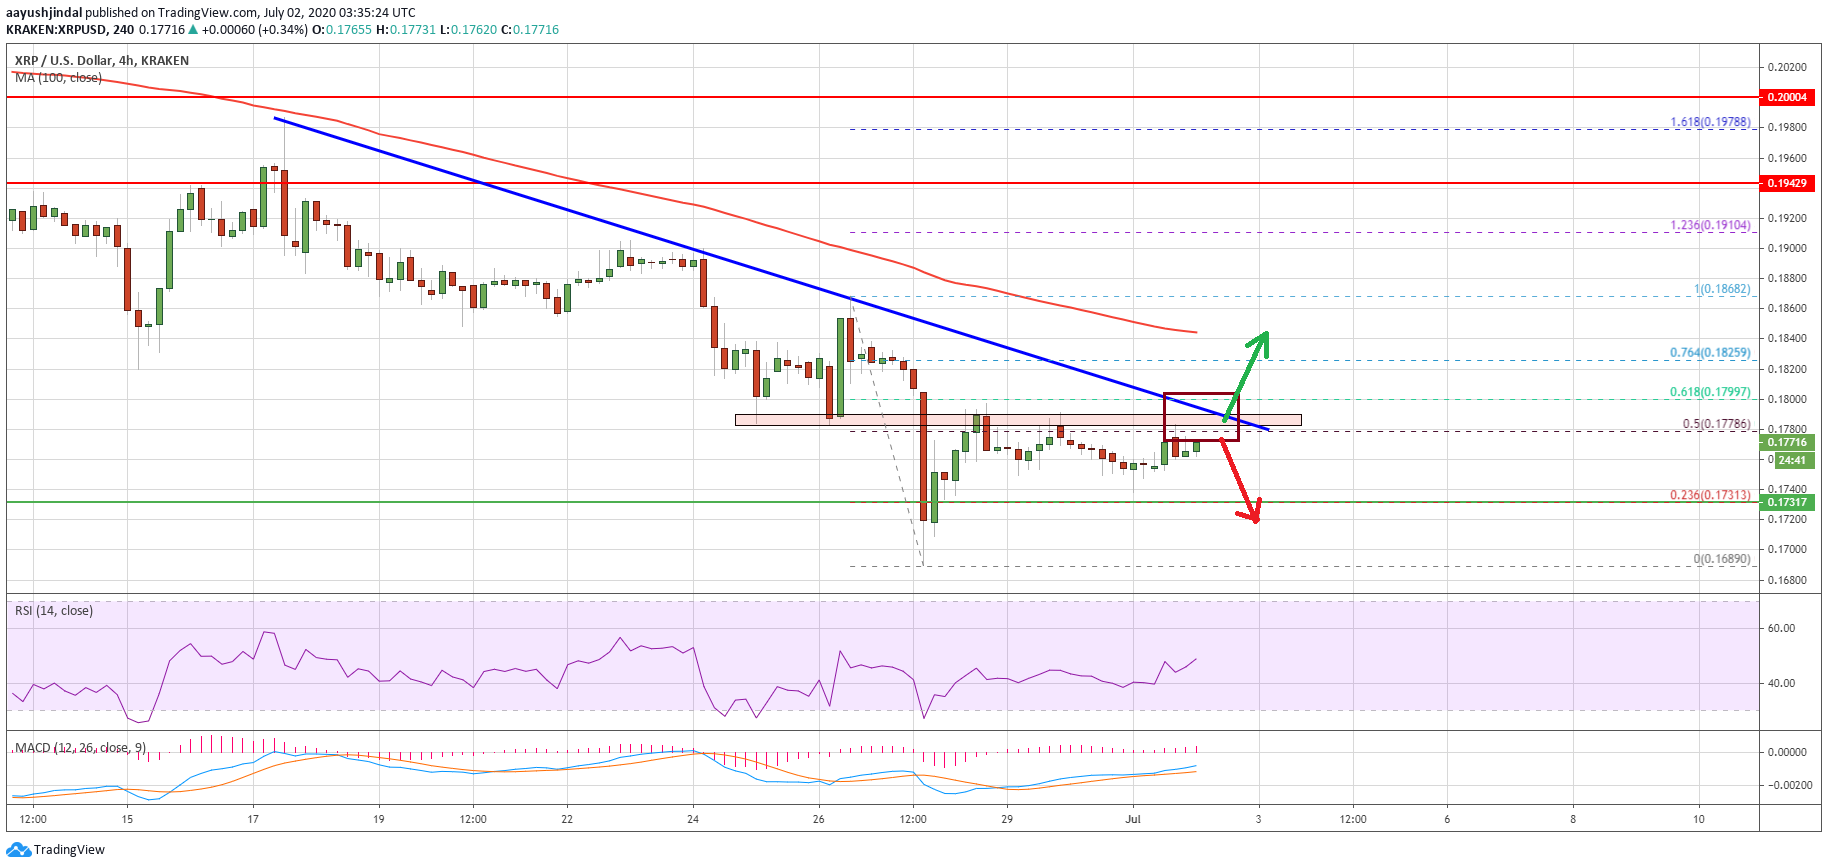
Ripple price below $0.1800. Source: TradingView.com
It seems like ripple is preparing for a crucial upside break above the $0.1800 resistance. If bitcoin climbs above the $9,300 resistance, there are high chances of a bullish break in XRP above $0.1800.
The next key resistance above $0.1800 is near the $0.1850 level and the 100 simple moving average (4-hours). Any further gains could lead the price towards the next set of hurdles near $0.1900 and $0.1920 in the coming sessions.
Fresh Decline in XRP?
If ripple price fails to surpass the $0.1780 and $0.1800 resistance levels, there are chances of a fresh decline. An initial support is near the $0.1730 level.
The first key support is near the $0.1720 level, below which the price might continue to move down. The next support is near the $0.1680 level, followed by the $0.1650 pivot level.
Technical Indicators
4-Hours MACD – The MACD for XRP/USD is slowly gaining momentum in the bullish zone.
4-Hours RSI (Relative Strength Index) – The RSI for XRP/USD is currently approaching the 50 level.
Major Support Levels – $0.1720, $0.1680 and $0.1650.
Major Resistance Levels – $0.1780, $0.1800 and $0.1850.
Take advantage of the trading opportunities with Plus500
Risk disclaimer: 76.4% of retail CFD accounts lose money.


