
Reason to trust
How Our News is Made
Strict editorial policy that focuses on accuracy, relevance, and impartiality
Ad discliamer
Morbi pretium leo et nisl aliquam mollis. Quisque arcu lorem, ultricies quis pellentesque nec, ullamcorper eu odio.
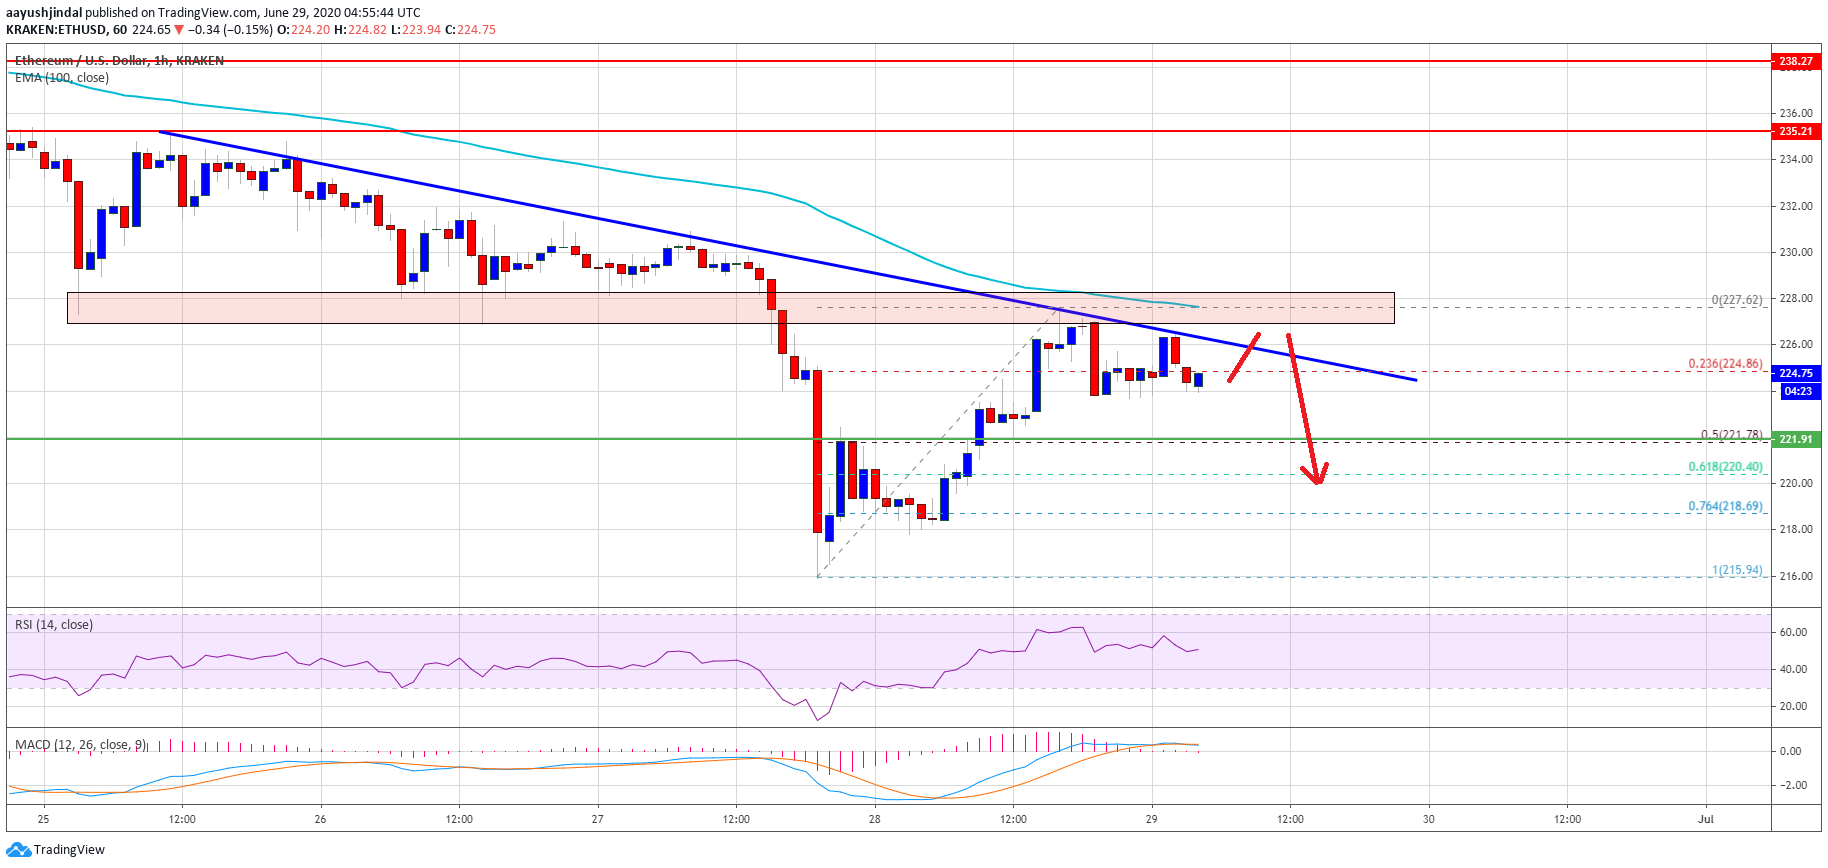
Ethereum is currently recovering from the $216 swing low against the US Dollar. ETH is now facing an uphill task near $228-$230, and it could resume its slide.
- Ethereum is currently trading above the $220 and $222 resistance levels.
- The price is now facing a crucial resistance near the $228 level and the 100 hourly simple moving average.
- There is a major bearish trend line forming with resistance near $226 on the hourly chart of ETH/USD (data feed via Kraken).
- The pair could resume its decline if it fails to clear the $226 and $228 resistance levels.
Ethereum Price is Near Crucial Juncture
After a strong decline below $225, Ethereum found support near the $215 region against the US Dollar. ETH price traded as low as $216 and recently started an upside correction above the $220 level.
The price was able to climb above the $220 and $222 resistance levels. However, ether seems to be facing a crucial resistance near the $228 level and the 100 hourly simple moving average. There is also a major bearish trend line forming with resistance near $226 on the hourly chart of ETH/USD.
The pair is currently consolidating near the 23.6% Fib retracement level of the recent move from the $216 swing low to $228 high. An initial support is near the $222 level (the recent breakout zone).
Ethereum price testing $225: Source: TradingView.com
The 50% Fib retracement level of the recent move from the $216 swing low to $228 high is also near $222. On the upside, the price is clearly facing a major hurdle near the $228 and $230 levels. To move into a positive zone, the bulls need to clear the $230 resistance and settle above the 100 hourly simple moving average.
Fresh Decline in ETH?
If Ethereum fails to clear the $228 and $230 resistance levels, it is likely to resume its decline. The $222 support might prevent the decline in the short term.
A successful break below the $222 support zone will most likely start a fresh decline. In the mentioned case, the price could revisit the $215 support region in the coming sessions.
Technical Indicators
Hourly MACD – The MACD for ETH/USD is about to move into the bearish zone.
Hourly RSI – The RSI for ETH/USD is just above the 50 level, with a bearish angle.
Major Support Level – $222
Major Resistance Level – $230
Take advantage of the trading opportunities with Plus500
Risk disclaimer: 76.4% of retail CFD accounts lose money.


