
Reason to trust
How Our News is Made
Strict editorial policy that focuses on accuracy, relevance, and impartiality
Ad discliamer
Morbi pretium leo et nisl aliquam mollis. Quisque arcu lorem, ultricies quis pellentesque nec, ullamcorper eu odio.
Bitcoin recovered sharply after trading to a new monthly low at $8,910 against the US Dollar. BTC is now trading above the 100 hourly SMA, but it is facing a major resistance at $9,500.
- Bitcoin is up more than 4% and recovered most losses to trade above $9,400.
- The price is now facing a major hurdle near the $9,500 resistance zone.
- There was a break above a major bearish trend line with resistance near $9,330 on the hourly chart of the BTC/USD pair (data feed from Kraken).
- The pair could either rally further above the $9,500 resistance or it might resume its decline below $9,300.
Bitcoin Price Showing Positive Signs
Yesterday, we discussed the chances of more losses in bitcoin price below the $9,100 and $9,000 levels against the US Dollar. BTC did extend its decline below the $9,000 handle and traded to a new monthly low at $8,910.
However, the price started a strong upward move and broke many hurdles near $9,100 and $9,200. The bulls gained pace and even pushed the price above the $9,300 level and the 100 hourly simple moving average.
There was also a break above a major bearish trend line with resistance near $9,330 on the hourly chart of the BTC/USD pair. It opened the doors for more gains above the $9,400 level and the price tested the $9,500 resistance zone.
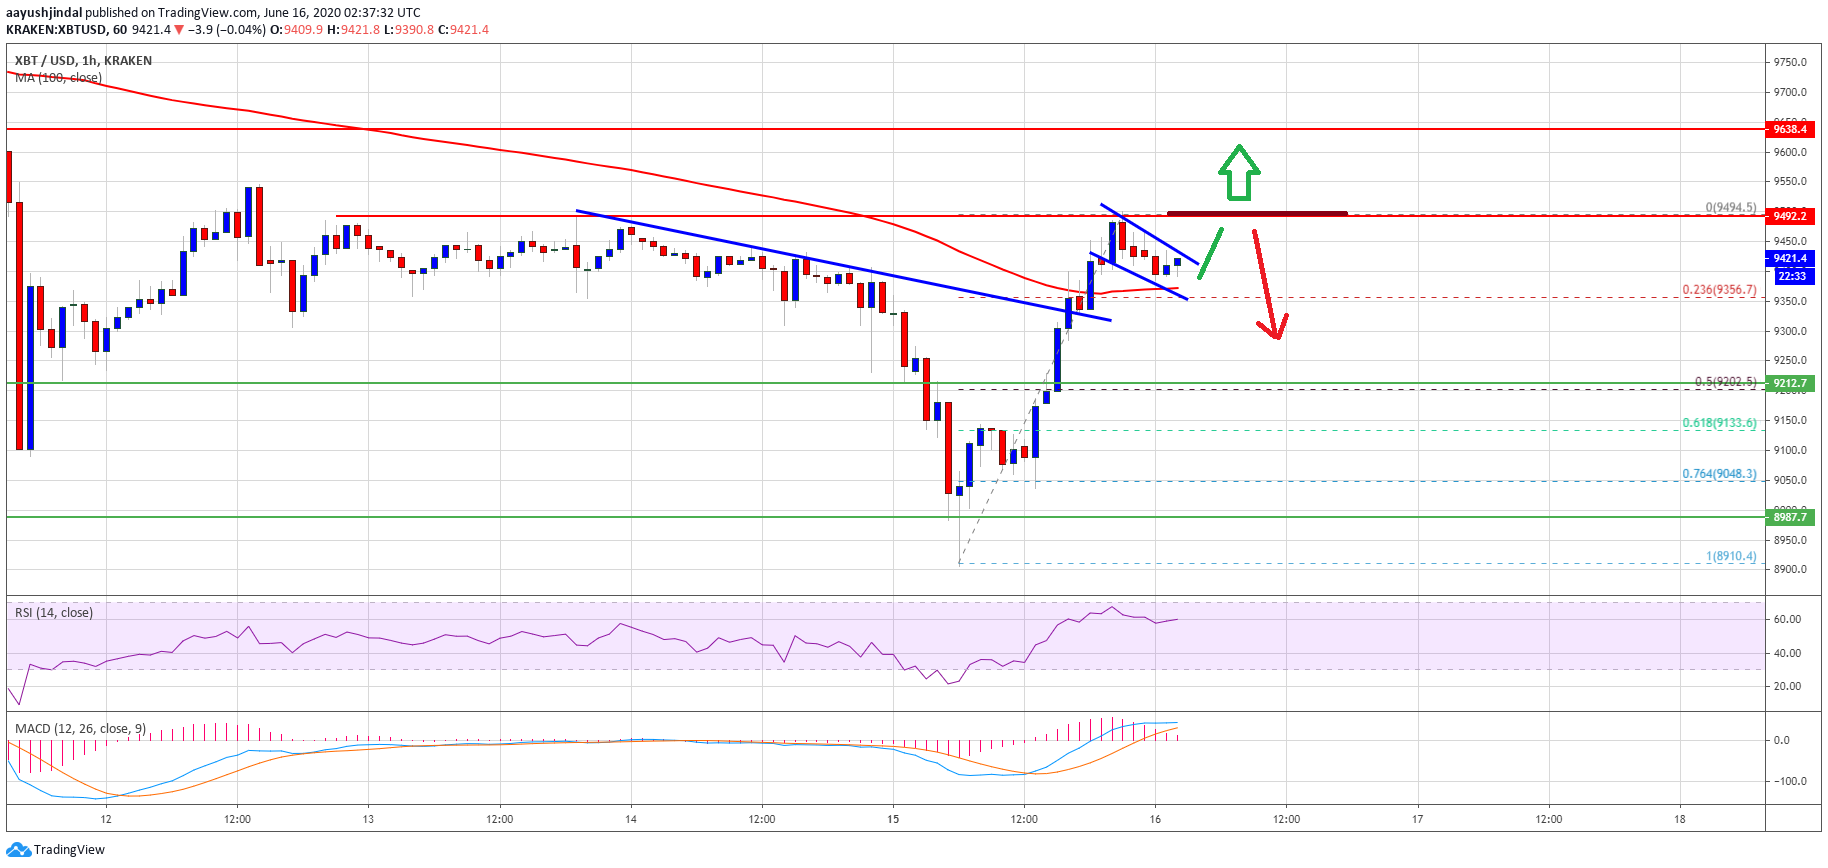
A high is formed near $9,494 and the price is currently consolidating gains. There is a short-term bullish flag formed with resistance near the $9,440 level. If there is a clear break above $9,440 and $9,450, there are chances of a fresh increase.
On the upside, bitcoin price must clear the $9,500 resistance zone to move further into a positive zone. The next major resistance is seen near the $9,640 level, above which the price could revisit $9,800.
Bearish Reaction From $9,500 in BTC?
If bitcoin fails to continue higher above the $9,500 resistance, it could react to the downside. An initial support is seen near the $9,400 level and the 100 hourly SMA.
A bearish break below the 100 hourly SMA could start a fresh downward move. In the mentioned case, there is a risk of more losses towards the $9,200 and $9,100 levels.
Technical indicators:
Hourly MACD – The MACD is currently gaining momentum in the bullish zone.
Hourly RSI (Relative Strength Index) – The RSI for BTC/USD is now well above the 50 level.
Major Support Levels – $9,400 followed by $9,100.
Major Resistance Levels – $9,500, $9,640 and $9,800.


