
Reason to trust
How Our News is Made
Strict editorial policy that focuses on accuracy, relevance, and impartiality
Ad discliamer
Morbi pretium leo et nisl aliquam mollis. Quisque arcu lorem, ultricies quis pellentesque nec, ullamcorper eu odio.
Bitcoin is recovering and showing positive signs above the $9,700 level against the US Dollar. BTC price is likely to accelerate higher above $10,000 as long as it is above the 100 hourly SMA.
- Bitcoin is correcting higher and it recently cleared the $9,740 resistance zone.
- The price even broke the $9,800 level and it traded as high as $9,884.
- There is a bullish continuation pattern forming with resistance near $9,850 on the hourly chart of the BTC/USD pair (data feed from Kraken).
- The pair could surge above $9,880 and $9,950 as long as it is above the $9,680 support.
Bitcoin Price Could Rally Again
After forming a decent support base above $9,400, bitcoin price started a fresh increase against the US Dollar. BTC broke traded above the $9,600 and $9,740 resistance levels to move into a positive zone.
It even settled above the $9,700 level and the 100 hourly simple moving average. Moreover, there was a break above a key bearish trend line at $9,690 on the hourly chart of the BTC/USD pair.
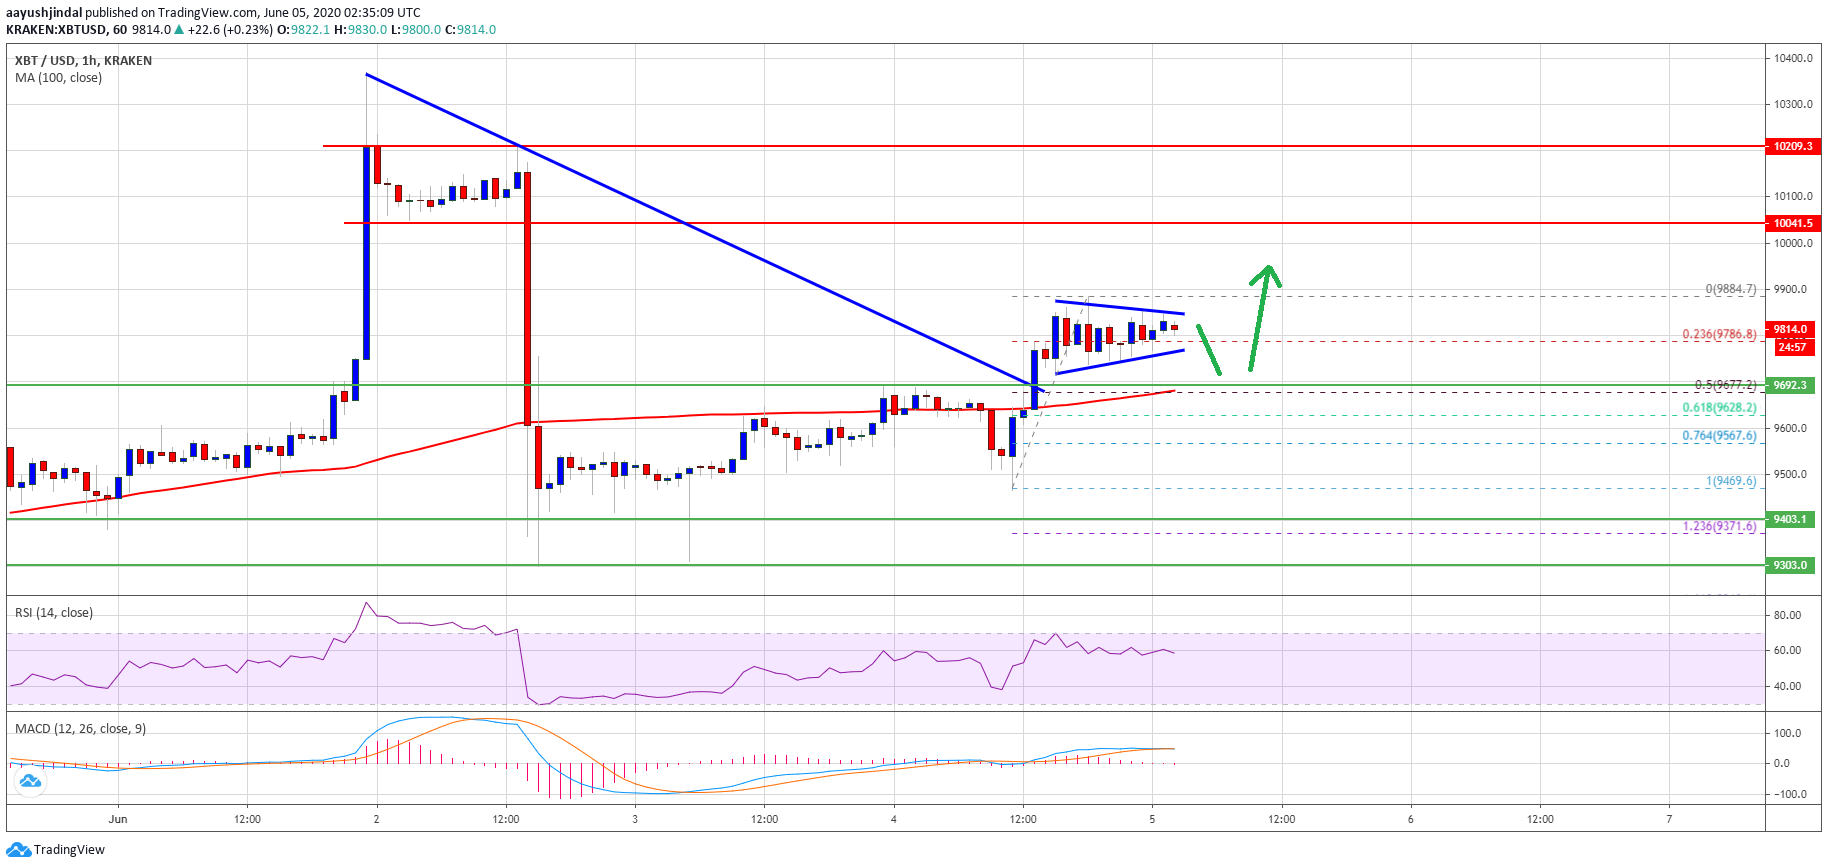
It opened the doors for more gains and the price traded as high as $9,884. Bitcoin is currently consolidating gains and trading near the $9,800 level. It tested the 23.6% Fib retracement level of the recent wave from the $9,469 low to $9,884 high.
There is also a bullish continuation pattern forming with resistance near $9,850 on the same chart. If there is an upside break above the triangle resistance, the price could accelerate above the $9,900 and $9,950 levels.
The first major resistance is near the $10,000 level, above which there are chances of more upsides towards the $10,400 and $10,500 resistance levels in the near term.
Fresh Decline in BTC?
On the downside, the first key support is near the triangle trend line at $9,780. If bitcoin price fails to break higher, it could correct lower below $9,780. The next major support is seen near the $9,680 level and the 100 hourly simple moving average.
The 50% Fib retracement level of the recent wave from the $9,469 low to $9,884 high is also near $9,677. Any further losses may perhaps negate the current bullish view and the price could dive towards the $9,400 support zone.
Technical indicators:
Hourly MACD – The MACD is struggling to gain bullish momentum in the bullish zone.
Hourly RSI (Relative Strength Index) – The RSI for BTC/USD is now moving nicely above the 50 level.
Major Support Levels – $9,780 followed by $9,680.
Major Resistance Levels – $9,880, $9,950 and $10,000.


