
Reason to trust
How Our News is Made
Strict editorial policy that focuses on accuracy, relevance, and impartiality
Ad discliamer
Morbi pretium leo et nisl aliquam mollis. Quisque arcu lorem, ultricies quis pellentesque nec, ullamcorper eu odio.
Bitcoin is currently correcting higher from the $9,300 support against the US Dollar. BTC price must clear the $9,740 and $9,800 resistance levels to continue higher in the near term.
- Bitcoin is currently showing a few positive signs above the $9,500 and $9,600 levels.
- The price is likely to gain bullish momentum if it breaks the $9,740 and $9,800 resistance levels.
- There is a bear flag forming with resistance near $9,740 on the hourly chart of the BTC/USD pair (data feed from Kraken).
- The pair could resume its decline if it fails to clear the $9,740 resistance zone.
Bitcoin Price Facing Hurdles
Yesterday, we saw a sharp U-turn in bitcoin price from well above $10,000 against the US Dollar. BTC broke many key supports near $9,800 and the 100 hourly simple moving average.
It even spiked below the $9,500 support and tested the $9,300 support area. A low is formed near $9,299 and the price is currently correcting higher. It is now trading above the $9,500 pivot level.
There was a break above the 23.6% Fib retracement level of the downward move from the $10,366 high to $9,299 low. Moreover, it is trading above the $9,600 level and the 100 hourly simple moving average.
It seems like there is a bear flag forming with resistance near $9,740 on the hourly chart of the BTC/USD pair. The channel resistance zone is close to the recent breakdown zone at $9,740. There is also a connecting bearish trend line forming with resistance near $9,745 on the same chart.
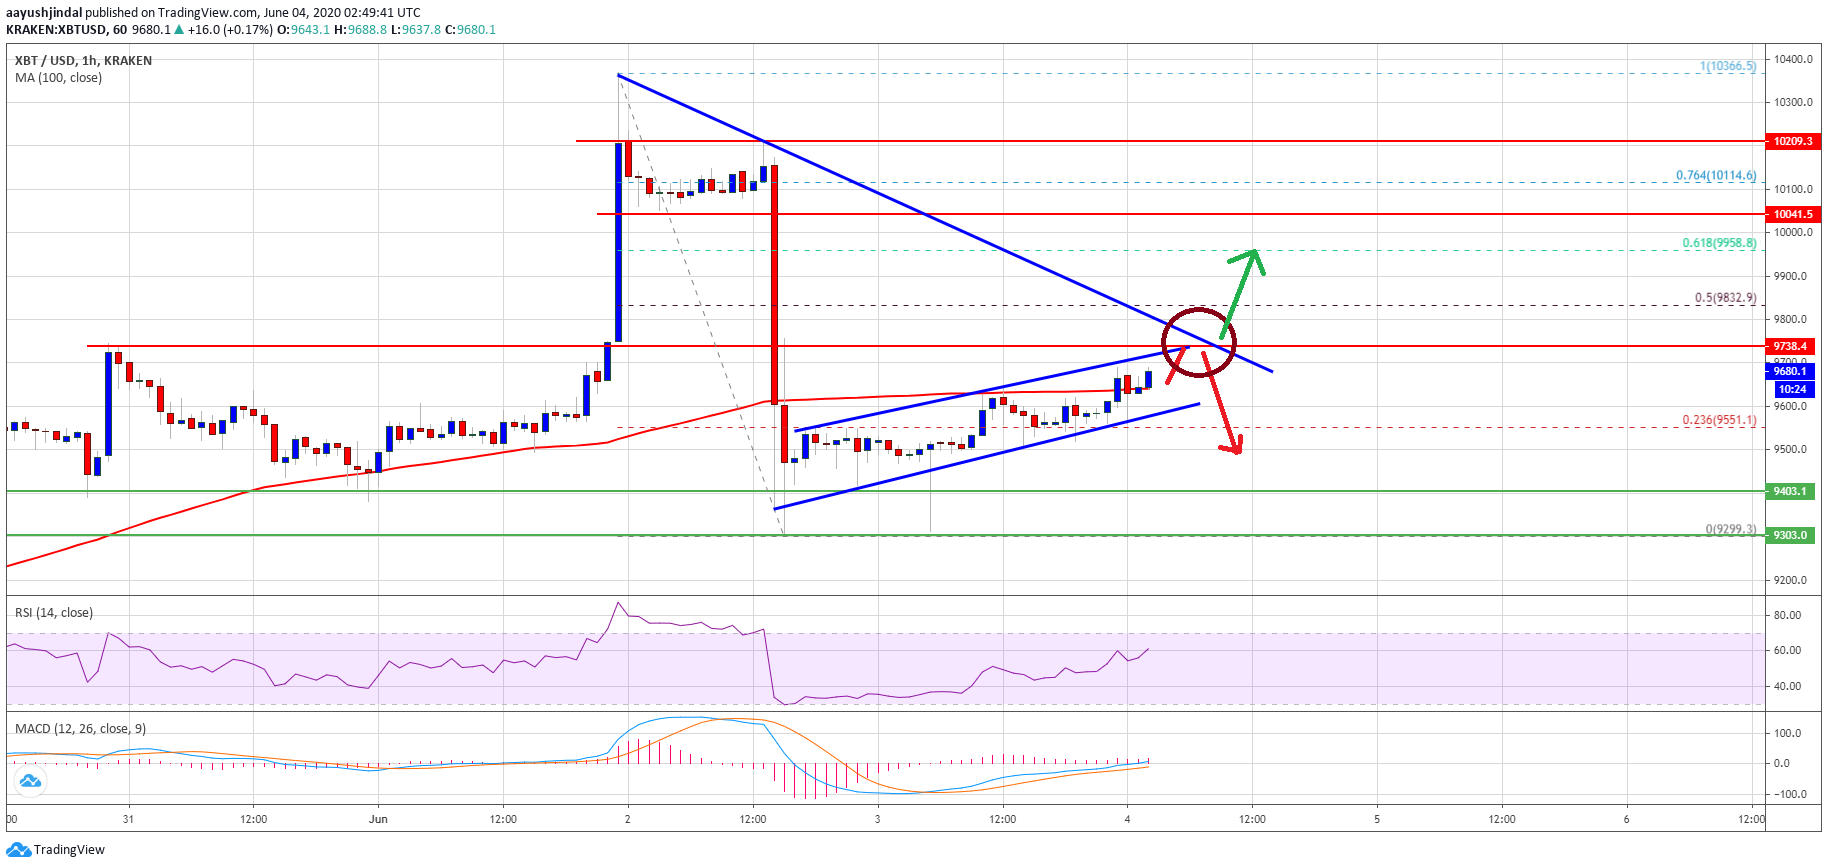
If bitcoin price clears the trend line resistance, it could test the next major resistance near $9,800. The 50% Fib retracement level of the downward move from the $10,366 high to $9,299 low is also near $9,832.
If the bulls manage to clear the $9,740 and $9,800 resistance levels, there are chances of a steady rise in the coming sessions. The next key resistance zone is seen near the $10,000 level.
Fresh Decline in BTC?
There are chances of another downside break in bitcoin if it struggles to clear $9,740 and the trend line resistance. On the downside, the first key support is near the flag channel at $9,600.
A clear break below the bear flag at $9,600, it could accelerate losses. An immediate support is at $9,500, below which there is a risk of more downsides towards the $9,300 level.
Technical indicators:
Hourly MACD – The MACD is slowly moving in the bullish zone.
Hourly RSI (Relative Strength Index) – The RSI for BTC/USD is now well above the 50 level.
Major Support Levels – $9,600 followed by $9,500.
Major Resistance Levels – $9,740, $9,800 and $9,830.


