
Reason to trust
How Our News is Made
Strict editorial policy that focuses on accuracy, relevance, and impartiality
Ad discliamer
Morbi pretium leo et nisl aliquam mollis. Quisque arcu lorem, ultricies quis pellentesque nec, ullamcorper eu odio.
Bitcoin is trading nicely above the $9,400 support zone against the US Dollar. BTC price is likely to continue higher towards $10,000 if it clears $9,600 and $9.750.
- Bitcoin is trading with a positive bias above the $9,400 support zone.
- The price could struggle to clear the $9,600 and $9,750 resistance levels in the short term.
- There was a break above a key contracting triangle with resistance near $9,500 on the hourly chart of the BTC/USD pair (data feed from Kraken).
- The pair could start a strong increase if it clears the $9,600 and $9,750 resistance levels.
Bitcoin Price Could Rise Further
After a successful close above the $9,300 level, bitcoin price extended its rise above the $9,400 resistance against the US Dollar. BTC price even settled above the $9,500 level and the 100 hourly simple moving average.
It traded as high as $9,745 and recently started a downside correction. It traded below the $9,600 and $9,500 levels. However, the previous key resistance near $9,400 and the 100 hourly simple moving average acted as major supports.
A low is formed near $9,381 and bitcoin is currently rising. There was a break above the 23.6% Fib retracement level of the key decline from the $9,745 high to $9,381 low.
Moreover, there was a break above a key contracting triangle with resistance near $9,500 on the hourly chart of the BTC/USD pair. The pair is now testing the 50% Fib retracement level of the key decline from the $9,745 high to $9,381 low.
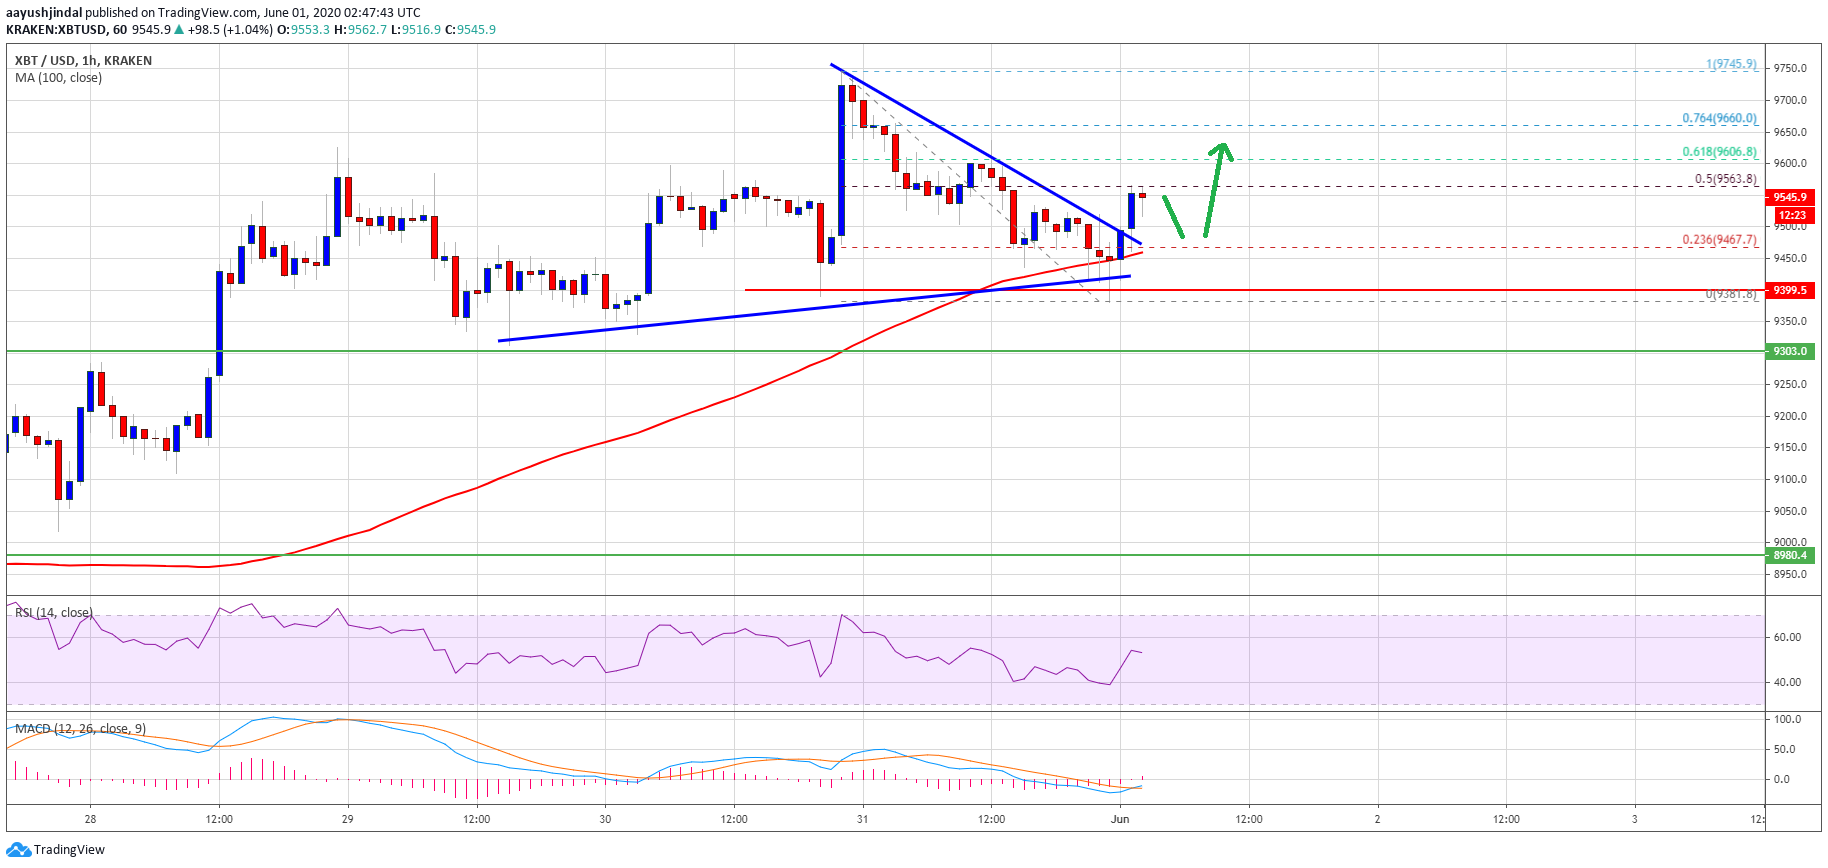
On the upside, the first major resistance is near the $9,600 level. The next major hurdle is near the $9,750 level, above which the bulls are likely to aim a larger rally towards $10,000 or $10,500 in the near term.
Dips Supported in BTC
If bitcoin fails to continue higher above $9,600 or $9,700, there could be a downside correction. An initial support is near the $9,450 level or the 100 hourly simple moving average.
The main support is still near the $9,400 level, below which the price could extend its decline towards the .
Technical indicators:
Hourly MACD – The MACD is slowly reducing its current bullish slope.
Hourly RSI (Relative Strength Index) – The RSI for BTC/USD is currently well above the 60 level.
Major Support Levels – $9,350 followed by $9,300.
Major Resistance Levels – $9,650, $9,800 and $10,000.


